Ordinary differential equations: Bifurcations
 Bifurcations and bifurcation diagrams
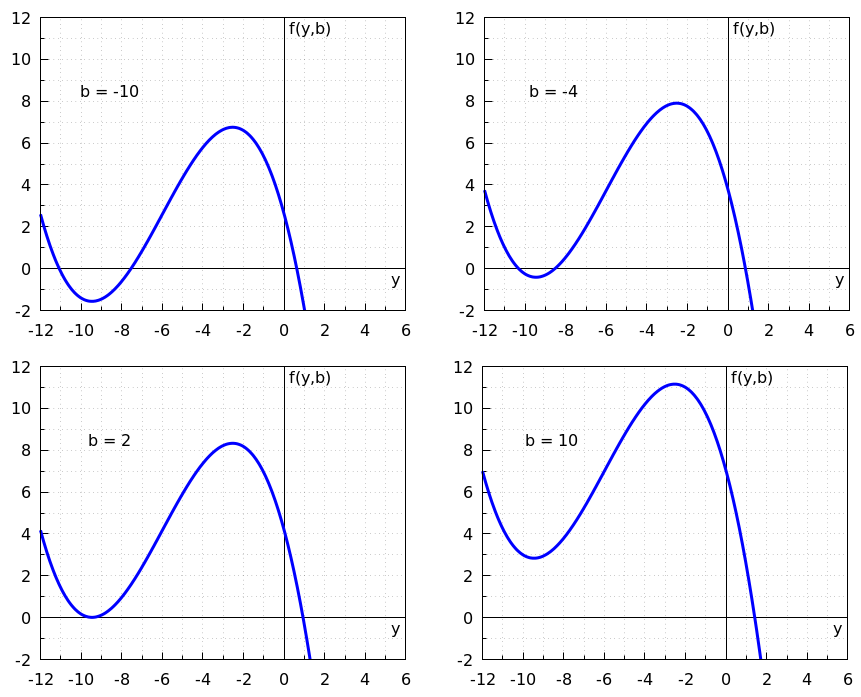
We consider the differential equation \[\frac{\dd y}{\dd t}=f(y,b)\] where \(f\) is some function and \(b\) a parameter. The figure below shows the graphs of the right-hand side of the differential equation as a function of \(y\) for four different parameter values, namely for \(b=-10\), \(b=-4\), \(b=2\) and \(b=10\). For values of \(b\) between \(-10\) and \(10\) the functions change neatly so that the graphs will always lie neatly between the graphs shown.


Which bifurcation value, named \(b^{\ast}\!\), can be deduced from the shown graphs?
\(b^{\ast}={}\)
The number of equilibria changes in the bifurcation:
for \(-10\le b< b^{\ast}\) the number of equilibria is equal to
for \(\phantom{-}b^{\ast}\lt b \lt 10 \) the number of equilibria is equal to
Select the right elements from the following drop-down menus so that you finally get the phase line of this differential equation.at the bifurcation value \(b^{\ast}\!\).
Unlock full access


