5. Sampling: Practical 5a
 Stratified Sampling
In this set of exercises, you are going to apply stratified sampling to the above-ground biomass (agb) of the trees in the BCI dataset. The final sample should contain #100# individuals.
Let's first take a look at the distribution of agb and divide the dataset into strata. Since the distribution is strongly positively skewed, it is recommended to visualise the log10 distribution.
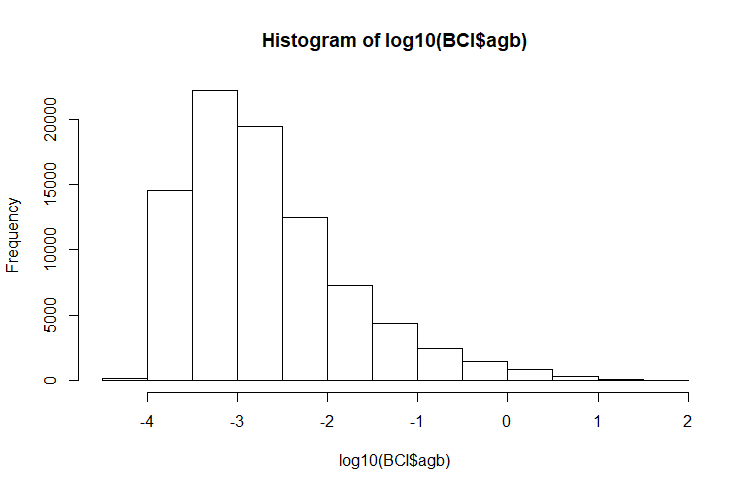
Let's divide the dataset into #5# classes. We take -3.5 -3.0 -2.5 -1.5 as class limits.
How many observations does class1_trees contain?
Let's first take a look at the distribution of agb and divide the dataset into strata. Since the distribution is strongly positively skewed, it is recommended to visualise the log10 distribution.
hist(log10(BCI$ agb))
Let's divide the dataset into #5# classes. We take -3.5 -3.0 -2.5 -1.5 as class limits.
BCI$ biomasscl <- NAUse the code above (i.e. the variable biomasscl) to divide the BCI dataframe into #5# separate dataframes. You can name these dataframes class1_trees, class2_trees etc.
BCI$ biomasscl[ log10(BCI$ agb)< -3.5 ] <- 1
BCI$ biomasscl[ log10(BCI$ agb)>= -3.5 & log10(BCI$ agb)< -3 ] <- 2
BCI$ biomasscl[ log10(BCI$ agb)>= -3 & log10(BCI$ agb)< -2.5 ] <- 3
BCI$ biomasscl[ log10(BCI$ agb)>= -2.5 & log10(BCI$ agb)< -1.5 ] <- 4
BCI$ biomasscl[ log10(BCI$ agb)>= -1.5 ] <- 5
How many observations does class1_trees contain?
class1_trees contains observations.
Unlock full access


