Vectors: Vector calculus in MATLAB
 Creation of vectors
A vector in MATLAB is a 1-dimensional array of numbers. You can work both with row vectors and column vectors.
Row and column vectors A row vector is created by putting the numbers in a list and separating them with a space or comma.
You get a column vector when you separate the components with semicolons.
Below are, behind the prompts in the MATLAB command window, commands to create a vector of any type. The final command illustrates that a transposed vector is obtained by means of an apostrophe.
>> rv = [4 5 6]      % row vector
rv =
     4     5     6
>> cv = [4; 5; 6]    % column vector
cv =
     4
     5
     6
>> cv'      % transposed vector
ans =
     4     5     6
Dimension and norm With the length command you can determine the dimension of a vector. Do not confuse this with what is understood in mathematics by the (Euclidean) length of a vector, namely the norm. The norm can be calculated numerically in MATLAB with the command norm and there are options to calculate variations.
>> dimension = length(rv)
dimension =
     3
>> euclideanlength = norm(rv) % Euclidean length
lengte =
8.7750
>> norm1 = norm(rv,1)         % sum of absolute values of components
norm1 =
    15
>> infnorm =  norm(rv,inf)    % maximum of absolute values of components
infnorm =
     6
Special constructions There are also special commands to create specific vectors; we show a few commonly used constructions.
>> v1 = 5:10      % from 5 up to and including 10
v1 =
     5     6     7     8     9    10
>> v2 = 10:-2:5    % from 10 down to and including 5 with steps of -2
v2 =
    10     8     6
>> v3 = linspace(0,1,6)   % equidistant distribution of 6 points in [0,1]
v3 =
         0    0.2000    0.4000    0.6000    0.8000    1.0000
>>  v4 = zeros(3,1)   % column vector with 3 zeros
v4 =
     0
     0
     0
>> v5 = ones(1,3,'logical')   % row vector with logical values 1
v5 =
  1×3 logical array
   1   1   1
>> v6 = []   % empty 0-dimensional vector
v6 =
     []
Concatenating vectors You can create new vectors by concatenating vectors.
>> v1 = 1:3;   v2 = 4:6;   v12 = [v1 v2]
v12 =
     1     2     3     4     5    6
Randomly generated vectors In simulations you can make extensive use of vectors with randomly generated numbers, i.e., with random numbers. There are several instructions for this purpose.
rand |
random numbers between 0 and 1 using a uniform distribution |
randi |
random numbers via a discrete uniform distribution |
randn |
random numbers using the standard normal distribution |
>> rand(1,5)   % 5 random numbers between 0 and 1
ans =
    0.7577    0.7431    0.3922    0.6555    0.1712
>> randi( [5,8], 1, 10 )   % 10 random integers between 5 en 8 (inclusive)
ans =
     8     7     7     8     8     7     5     5     8     5
>> randn(1,8)  % 8 random numbers generated from the standard normal distribution
ans =
   -0.0245   -1.9488    1.0205    0.8617    0.0012   -0.0708   -2.4863    0.5812
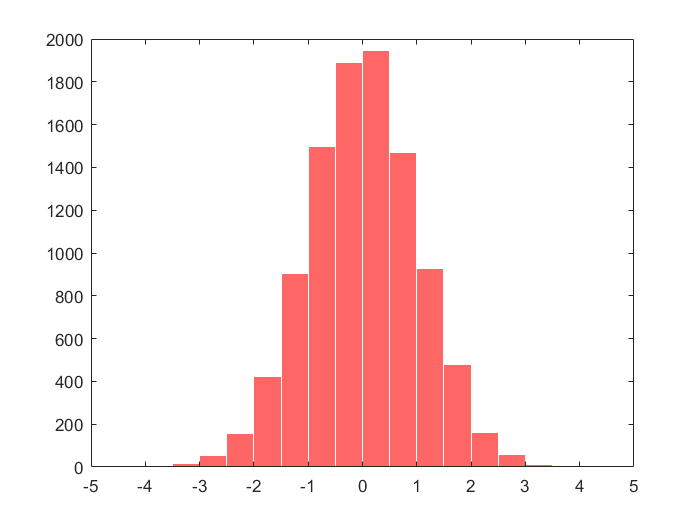
>> x = -5:0.5:5;
>> y = randn(1,10000);
>> h = histogram(y,x);     % construct a histogram from the data and plot it
>> set(h,'FaceColor','r','EdgeColor','w')   % adjust the diagram style


