Ordinary differential equations: Slope field and solution curves with Matlab
 Drawing a slope field with integral curves [MATLAB worked-out solution]
We consider the differential equation \[\frac{\dd y}{\dd t}=\frac{4-2t}{3y^2-5}\]
Assignments
- Determine the general solution of the differential equation in implicit form by the method of separation of variables.
- Draw a slope field and use the
contourfunction to draw some integral curves in it.
Worked-out solution
- We write the differential equation in differential form and apply separation of variables: \[(3y^2-5)\,\dd y=(4-2t)\,\dd t\] When we integrate on both sides we get \[\int (3y^2-5)\,\dd y=\int (4-2t)\,\dd t\] So: \[y^3 -5y=4t-t^2+C\] for some constant \(C\). In other words, \[F(t,y)=C\] where \[F(t,y)=y^3-5y+t^2-4t\]
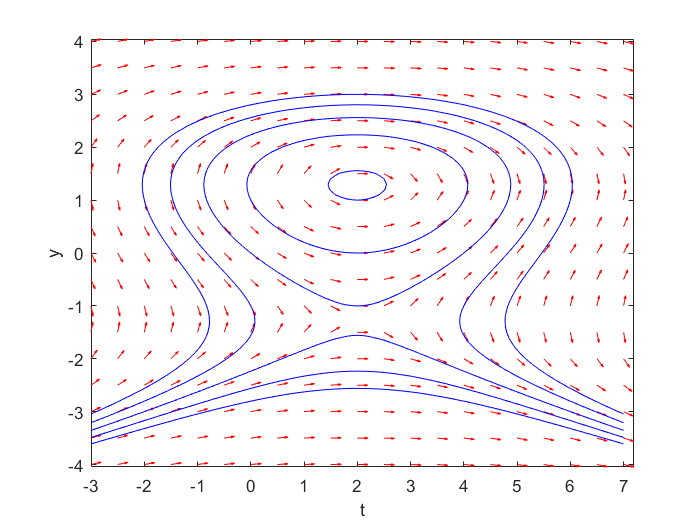
- You are asked to draw a slope field and some integral curves in one diagram. The last aspect concerns the drawing of contours of \[F(t,y)=y^3-5y+t^2-4t\] The following code produces the diagram below:
>> clear
>> [t,y] = meshgrid(-3:0.5:7, -4:0.5:4);
>> dy = (4-2*t)./(3*y.^2-5);
>> dt = ones(size(dy));
>> L = sqrt(dt.^2 + dy.^2);
>> dyu = dy./L;
>> dtu = dt./L;
>> figure
>> % drawing the slope field
>> quiver(t, y, dtu, dyu, 0.3, 'r'), axis tight
>> xlabel 't', ylabel 'y';
>> hold on  % continue drawing in the same window
>> % Draw integral curves in blue
>> [t,y] = meshgrid(-3:0.1:7, -4:0.1:4);
>> contour(t,y, y.^3 - 5*y + t.^2 - 4*t, [-8,-4, 0, 4, 8], 'b');

The integral curves describe more than one solution curve. The outer integral curve does this for 3 solution curves that depend on an initial value. We distinguish as solution curves
- the top part with \(y\) values greater than \(\frac{1}{3}\sqrt{15}\);
- the middle part with \(y\) values between \(-\frac{1}{3}\sqrt{15}\) and \(\frac{1}{3}\sqrt{15}\);
- the lower part smaller than \(-\frac{1}{3}\sqrt{15}\)
Unlock full access


