Ordinary differential equations: Slope field and solution curves with R
 Drawing a slope field [R worked-out solution]
We consider the differential equation \[\frac{\dd y}{\dd t}=1-2t y\]
Part 1
In the first part of the assignment we must plot the slope field of the above differential equation making use of graphics elements such as line segments. Here we choose an object-oriented graphical approach and draw on a regular grid line elements of length 1.
xp <- seq(from=0, to=2, length=10)
yp <- seq(from=0, to=2, length=10)

plot(c(0,2),c(0,2), main="lijnelementenveld bij y'1 - 2ty", ylab = "y", xlab = "t", pch = ".")

for(x in xp){
  for(y in yp){
    u <- 1.0
    v <- 1.0 - 2.0*x*y
    L <- sqrt(u*u+v*v)
    u <- u/L
    v <- v/L
    segments(x-0.05*u,y-0.05*v,x+0.05*u,y+0.05*v, col="blue")
  }
}
The result is the following figure:
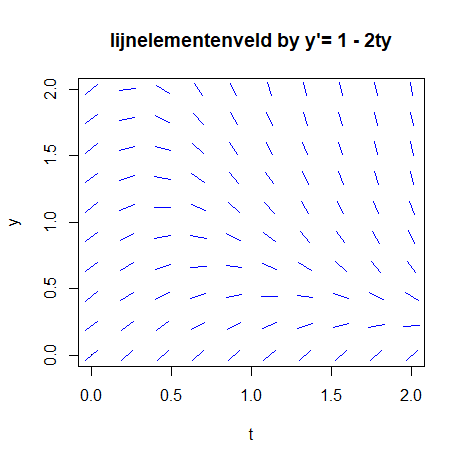
Part 2
In the second part of the task we adapt the program so that \(2000\) random coordinates within the region \(0\le t\le 2, 0\le y\le 2, \) are generated. Hereafter we plot the lineal elements at the points specified by these coordinates. Below is sample code:
xp <- runif(2000, min=0, max=2)
yp <- runif(2000, min=0, max=2)

plot(c(0,2),c(0,2), main="lijnelementenveld by y'= 1 - 2ty", ylab = "y", xlab = "t", pch = ".")

for(k in 1:2000){
  x <- xp[k]
  y <- yp[k]
  u <- 1.0
  v <- 1.0 - 2.0*x*y
  L <- sqrt(u*u+v*v)
  u <- u/L
  v <- v/L
  segments(x-0.05*u,y-0.05*v,x+0.05*u,y+0.05*v, col="gray")
}
The result is the following figure:

Unlock full access


