Ordinary differential equations: Asymptotics and stability
 Asymptotics
In asymptotics of an initial value problem, it is all about the behaviour of solutions when the time \(t\) approaches one of its boundaries of the maximal interval of existence of the differential equation. It can simply be that solutions reach infinity in finite time, a phenomenon called blow-up, or it may involve the approach of a solution of a differential equation towards a specific solution in the course of time. The following examples illustrate the diversity of asymptotic behaviour of solutions of initial value problems.
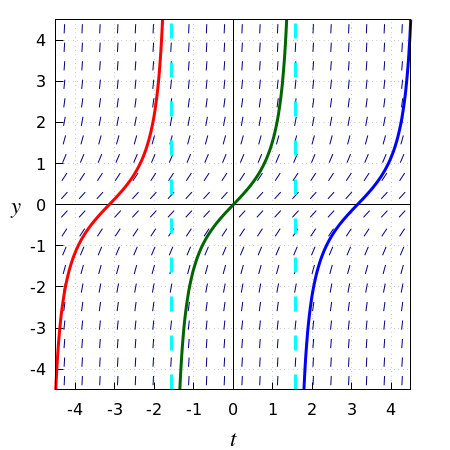
Consider the following differential equation: \[\frac{\dd y}{\dd t}=1+y^2\] The slope field of this differential equation is shown in the figure below, together with some solution curves. Do you recognize the green curve through \((0,0)\)? Indeed, this is the graph of the tangent function. The black dashed lines mark the endpoints of the maximal intervals of existence of this differential equation of width \(\pi\) for initial values \(y(k\cdot\pi)=0\) with some integer \(k\). The asymptotic behaviour of the solution \(y(0)=0\) is: \[\lim_{t\uparrow \frac{\pi}{2}}=\infty\quad\text{and}\quad \lim_{t\downarrow -\frac{\pi}{2}}=-\infty\] These limits mean in 'ordinary language' that the function values become plus or minus infinity when time \(t\) approaches the value \(\tfrac{1}{2}\pi\) from the left (from the bottom) and approaches the value \(-\tfrac{1}{2}\pi\) from the right (from the top).

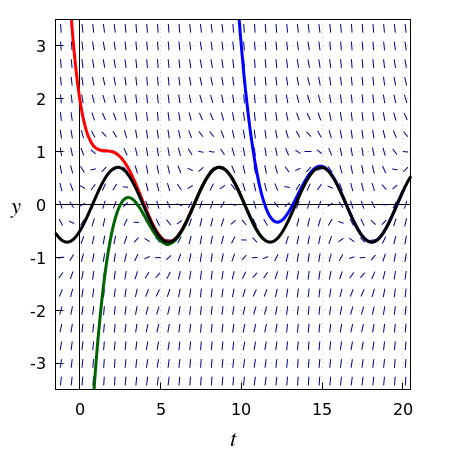
Consider the following differential equation: \[\frac{\dd y}{\dd t}=-y+\sin(t)\] The slope field of this differential equation is shown in the figure below, together with some solution curves. In this example, the asymptotic behaviour of each solution is the approach to a sinusoidal solution. The black solution curve is the plot of the specific solution \[y(t)=\tfrac{1}{2}\sqrt{2}\sin\left(t-\tfrac{1}{4}\pi\right)\] This is the only sinusoid that is a solution of this differential equation and all other solutions converge to this particular solution, that is, each solution behaves like a sinusoid after some time.

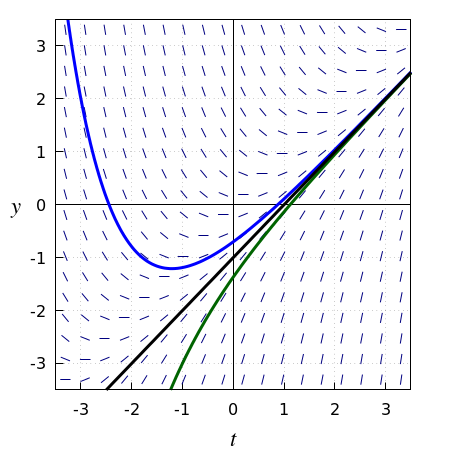
Consider the following differential equation: \[\frac{\dd y}{\dd t}=t-y\] The slope field of this differential equation is shown in the figure below, together with some solution curves. In this example, each solution curve approaches the graph of the solution \(y(t)=t-1\). The black solution curve is the plot of this particular solution.


