Ordinary differential equations: Asymptotics and stability
 Stability analysis based on sign patterns
We have already looked at the behaviour of solutions near an equilibrium for several autonomous first-order differential equations of the form \[\frac{\dd y}{\dd t}=\varphi(y)\] where \(\varphi\) is a neat function such that the previously discussed theorem for existence and uniqueness of solutions holds. More specifically, we require in what follows that the function \(\varphi\) has a continuous derivative. So far, we have used the slope field and solution curves to explain the behaviour near sufficiently close to an equilibrium. The big question was always what kind of equilibriium one has: repelling, attracting or semi-stable. We will address the stability analysis more systematiccaly via
- the sign pattern of the function \(\varphi\);
- local linearisation of \(\varphi\).
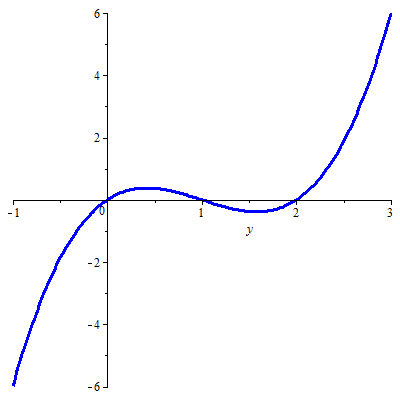
In this theory page we discuss the first method. This method can be explained best by means of a concrete example, say the ODE \[\frac{\dd y}{\dd t}=y(y-1)(y-2)\] The graph of the function \(\varphi(y)=y\,(y-1)(y-2)\) looks like this

In this diagram you can see the following:
- The ODE has equilibria \(y=0\), \(y=1\) and \(y=2\)
because here the function \(\varphi\) is equal to \(0\). - \(\displaystyle\left\{ \begin{array}{rl} \dfrac{\dd y}{\dd t}>0 & \text{for all points }(t,y)\text{ with } 0\lt y\lt 1\text{ or }y>2\\ \dfrac{\dd y}{\dd t}<0 & \text{for all points }(t,y)\text{ with } y<0\text{ or }1\lt y\lt 2\end{array}\right.\)
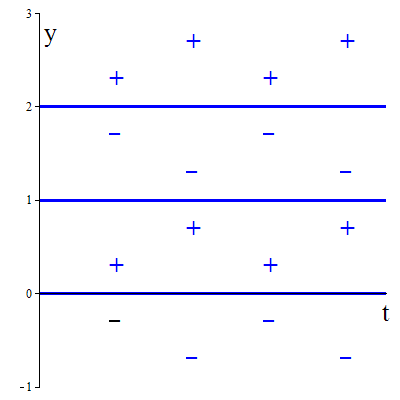
The sign pattern of the slopes \(\dfrac{\dd y}{\dd t}\), i.e, of the right-hand side of the ODE, is indicated in the figure below with plus and minus signs. It shows in which regions of the \(ty\)-plane solution curve goes up or down.

Because of the requirement that the function \(\varphi\) is just sufficiently neat so that the theorem of existence and uniqueness applies, solution curves cannot intersect each other and cannot pass a steady state. In particular, it means that the graph of an increasing or decreasing solution can only approach an equilibrium. For example, the solution curve through the point \((0,1\tfrac{1}{2})\) is descending and cannot pass the line \(y=1\), but approaches it as close at it can get. Thus, the line is \(y=1\) a horizontal asymptote of the solution curve going through \((0,1\tfrac{1}{2})\). The solution curve through the point \((0,\tfrac{1}{2})\) is ascending and cannot pass the line \(y=1\), but approaches it as close at it can get. Thus, the line is \(y=1\) a horizontal asymptote of the solution curve going through\((0,\tfrac{1}{2})\). More generally, all solution curves through points \((t,y)\) with \(1\lt y\lt 2\) are descending and have the line \(y=1\) as asymptote. All solution curves through points \((t,y)\) with \(0\lt y\lt 1\) are ascending and have the line \(y=1\) as asymptote. It follows that \(y=1\) is an attracting equilibrium. Similarly, the equilibria \(y=0\) and \(y=2\) turn out to be repelling.
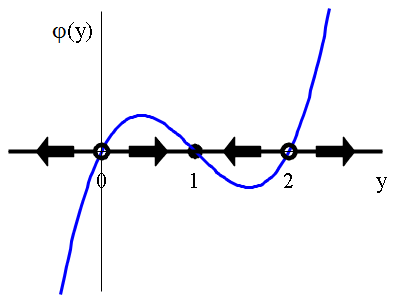
Instead of drawing the sign pattern of slopes \(\dfrac{\dd y}{\dd t}\) in a \((t,y)\)-plane, one also often uses a number line in which one indicates with arrows along this line whether the slope of the solution curve \(y(t)\) of the ODE at this value of \(y\) is positive or negative: an arrow pointing to right means an ascending solution curve and an arrow to the left means a descending solution curve. For the construction of this number line, which is called the phase line or state line of the ODE (or in some book is named phase portrait), one only needs to know whether values of the function \(\varphi\) at a point on the line is positive, zero, or negative. The figures below illustrate the construction of the phase line, in which open circles \(\large\circ\) represent repellers and a solid circle \(\large\bullet\) indicates an attractor. Please note that solid circles in phase lines are quite often also used to indicate equilibria whose stability is unknown or cannot be easily characterized as attracting or repelling.
The first figure below is the graph of the function \(\varphi(y)\) with on the horizontal axis arrows that indicate whether the function value is positive or negative, that is, whether the solution curves at this height in the \((t,y)\)-plane are ascending or descending. In an interval where \(\varphi(y)\) is positive we draw an arrow pointing to the right, and in an interval where \(\varphi(y)\) is negative we draw an arrow pointing to the left. At a point where \(\varphi(y)\) is equal to zero (an equilibrium), the type of arrows to the left and right of that fixed point determine the type of the euquilibrium: when the arrows are pointing to each other one has an attractor, when the arrows are pointing away from each other one has a repeller.

The above figure can be reduced to a one-dimension diagram, the so-called phase line or state line, which already contains all necessary information about stability of solutions: solid circles indicate acttractors, open circles indicate repellers, and arrows indicate the direction in which solution curves go in the course of time.

In this example we did not encounter a semi-stable equilibrium, but if you do come across it (e.g., in the ODE \(\dfrac{\dd y}{\dd t}=y^2\) ), then you indicate a half-stable equilibrium with sa half-solid/half-open circle such as ◐, in which the solid part is on the side where solutions are approaching the equilibrium and the open part is on the side where solutions are moving away from the equilibrium in the course of time.


