Ordinary differential equations: Slope field and solution curves
 Slope field
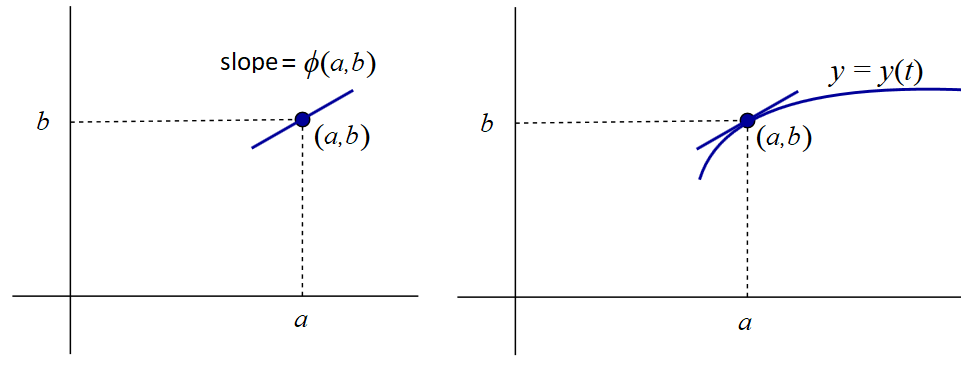
For a dynamic system of first order that can be written in the form \[\frac{\dd y}{\dd t}=\varphi(t,y)\] it holds for any point \((t,y)\) on the graph of a solution that the tangent line in that point has slope \(\varphi(t,y)\). To visualize this condition, one draws a short line segment with slope \(\varphi(t,y)\) centered at the point \((t,y)\) (see the left figure below). This segment is called a lineal element in \((t,y)\). The function \(y=y(t)\) is a solution of the differential equation through the point \((t,y)\) when the graph is tangent to the lineal element in \((t, y(t))\) (see the right figure below).

The figure on the left-hand side can be drawn at randomly chosen positions and the set of lineal elements is then called a slope field, gradient field, or direction field of the differential equation \(\dfrac{\dd y}{\dd t}=\varphi(t,y)\). The naming depends on allowance of vertical slopes and solution curves that are not graphs of a function (direction field) or a ban on vertical slopes and acceptance of only solution curves that are graphs of a function (slope field, gradient field). Usually one uses in a slope field or direction field a regular grid of points, but this is not necessary.
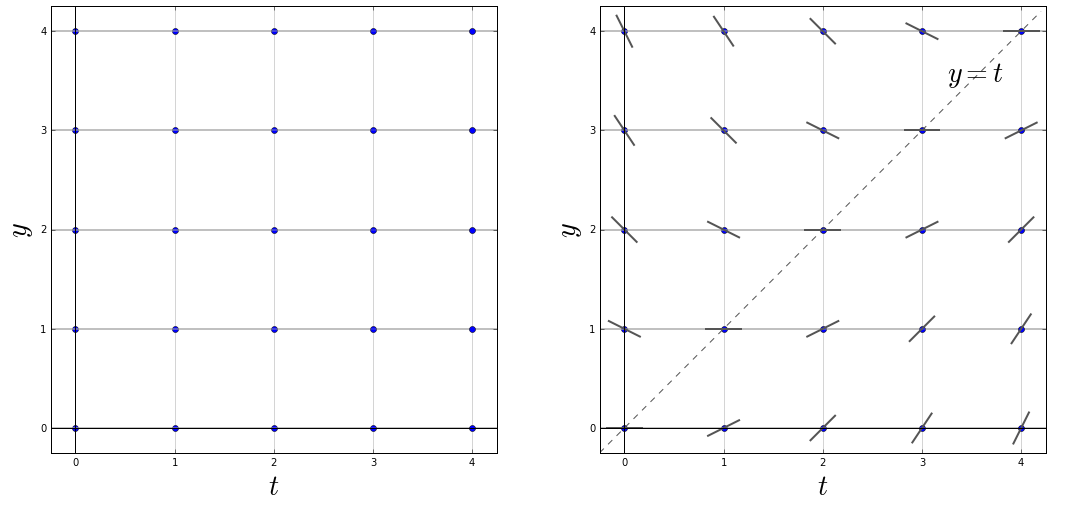
We will draw a slope field of the differential equation \[\frac{\dd y}{\dd t}=\frac{1}{2}(t-y)\] and we do this by drawing lineal elements on grid points with coordinates \(t=0,1,2,3,4\) and \(y=0,1,2,3,4\). We take graph paper and draw on it the selected grid points (the left side of the figure below). For each grid point \((t,y)\) we calculate the slope via the formula \(\frac{1}{2}(t-y)\). The following table shows all the values of the slopes
\[\begin{array}{c|c|c|c|c|c} y=4 & -2 & -1.5 & -1 & -0.5 & 0 \\ \hline y=3 & -1.5 & -1 & -0.5 & 0 & 0.5
\\ \hline y=2 & -1 & -0.5 & 0 & 0.5 & 1\\ \hline y=1 & -0.5 & 0 & 0.5 & 1 & 1.5 \\ \hline y=0 & 0 & 0.5 & 1 & 1.5 & 2\\ \hline & t=0 & t=1 & t=2 & t=3 & t=4\end{array}\] Using these values we draw a short line segment on the graph paper at each grid point with the corresponding slope (the lineal elements in the right-hand side of figure below).

Maybe you notice that for all points on the line \(y=x\) the corresponding lineal elements are horizontal. A collection of points in the plane in which the lineal elements have the same direction is called an isocline. The points in the plane in which the lineal elements have horizontal direction, form the set of zero isoclines or nullclines. In this examples they form the drawn line \(y=x\). This line divides the slope field into two pieces: the top left of this line is a region where all lineal elements have a negative slope, and below this line all lineal elements have a positive slope.


