Ordinary differential equations: Bifurcations
 Bifurcations and bifurcation diagram
Bifurcation We consider once more the differential equation of exponential growth with relative growth rate constant \(r\): \[\frac{\dd y}{\dd t}=r\cdot y\] The behaviour of the solutions depends on the sign of \(r\): if \(r<0\), then there is exponential decay and the equilibrium \(y=0\) is attracting; if \(r>0\), then there is exponential growth and the equilibrium \(y=0\) is repelling. This change in behaviour around an equilibrium is called a bifurcation and the parameter value for which this happens, in this case \(r=0\), is called a bifurcation value or bifurcation point.
This example is about the differential equation of exponential growth, but this game can of course be played for any differential equation with a parameter in the definition.
Bifurcation diagram Let us consider the following ODE as second example of a differential equation with a parameter that leads to bifurcations \[\frac{\dd y}{\dd t}=y^2+b\cdot y+1\] In order to determine the equilibria we need to compute the zeros of the quadratic equation \[y^2+b\cdot y+1=0\] in \(y\). But this depends on the sign of the discriminant \(D=b^2-4\):
- If \(D<0\), i.e., if \(-2<b<2\), then there is no zero and therefore the ODE has no equilibrium.
- If \(D=0\), i.e., if \(b=-2\) or \(b=2\), then there is only one equilibrium, namely \(y=1\) or \(y=-1\).
- If \(D>0\), then there exist two zeros and therefore two equilibria, namely \(y=\dfrac{-b\pm\sqrt{b^2-4}}{2}\).
The nature of these equilibria can be determined by standard methods for stability analysis:
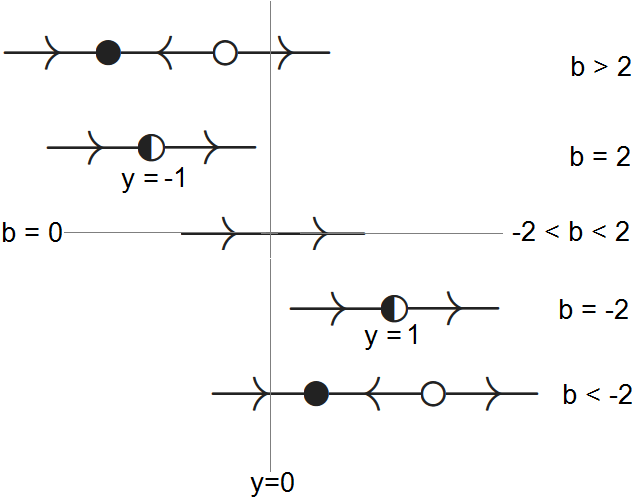
- If \(D=0\), i.e., if \(b=-2\) or \(b=2\), then we have the ODE \(\dfrac{\dd y}{\dd t}=(y-1)^2\) or \(\dfrac{\dd y}{\dd t}=(y+1)^2\). In both cases, the right-hand side of the ODE is a square. We have a semi-stable equilibrium and the phase line looks like

- If \(D>0\) then the right-hand side of the ODE is a valley parabola with two zeros. The function values between these two zeros are negative and the solution curves therefore are descending in this region. Elsewhere the function values of the quadratic function are positive and thus are solution curves in this area ascending. This reasoning leads to the following phase line
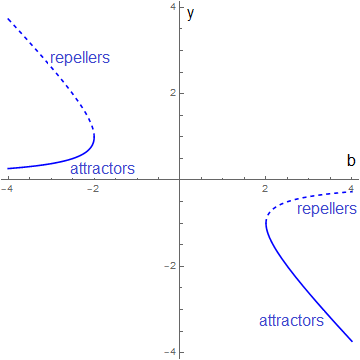
 . By the way, the nature of the equilibria can also be determined via local linearisation: because \(\varphi(y)=y^2+b\cdot y+1\) the values of \(\dfrac{\dd \varphi}{\dd y}\) are in the equilibria \(\pm\sqrt{b^2-4}\), where the minus sign indicates belongs to the largest value of the two existing equilibria and belongs to the repeller. The closer the value of \(|b|\) gets to \(2\), the more the equilibria move towards each other, near \((2,-1)\) and \((-2,1\), depending on the sign of the bifurcation parameter \(b\).
A common way to illustrate bifurcation is through the so-called bifurcation diagram. The possible equilibria are herein vertically plotted against the bifurcation parameter, which is present in the differential equation, on the horizontal axis. Repellers form dotted curves and attractors form solid curves so that they can easily be distinguished. In our example, the bifurcation diagram, in which we have added for clarity labels for attractors and repellers, looks as follows:

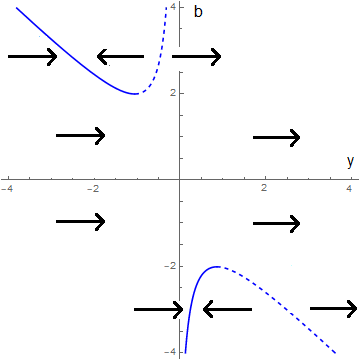
In the interactive version below you can vary the parameter \(b\) by dragging the corresponding green triangle along the horizontal axis. In this way you can explore how the slope field and the behaviour of solution curves depend on the bifurcation parameter \(b\). By displaying the derivative \(y'\) as a function of \(y\) you can read off the sign of an equilibrium value and thus determine the location of an equilibrium with respect to the origin.
\(\phantom{abc}\)In the rest of this section we consider various kinds of bifurcations.


