Fourier series: Introduction
 Example of a square wave
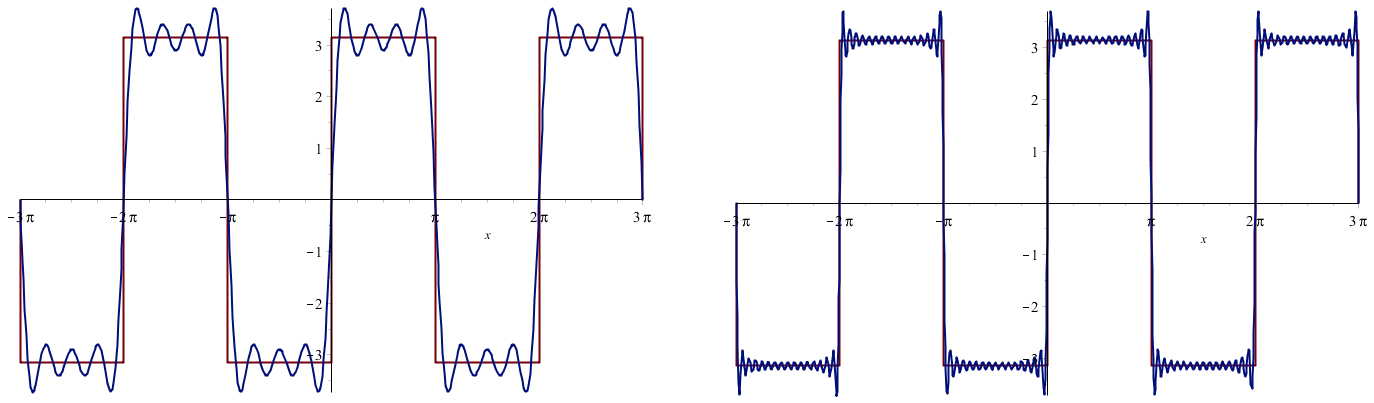
We consider the periodic continuation of the function \[f(x)=\begin{cases} -\pi & \text{if }-\pi\le x<0, \\ \pi & \text{if }0\le x<\pi\end{cases}\] The Fourier sine coefficients are \[\begin{aligned}b_n &=\frac{1}{\pi}\int_{-\pi}^{\pi} f(x)\sin(nx)\,\dd x \\ \\ &= -\int_{-\pi}^{0} \sin(nx)\,\dd x + \int_{0}^{\pi} \sin(nx)\,\dd x \\ \\ &= 2\int_{0}^{\pi} \sin(nx)\,\dd x \\ \\ &= 2\Bigl[\frac{-\cos(nx)}{n}\Bigr]_{0}^{\pi} \\ \\ &= \frac{2\bigl(1-\cos(n\pi)\bigr)}{n} \\ \\ &= \begin{cases} 0 & \text{if }n\text{ is even} \\ \\ \dfrac{4}{n} & \text{if }n\text{ is odd}\end{cases}\end{aligned}\] The Fourier sine series is in this case: \[f(x)=4\bigl(\sin(x) + \tfrac{1}{3}\sin(3x)+\tfrac{1}{5}\sin(5x)+\tfrac{1}{7}\sin(7x)+\cdots\bigr)\] In the figure below, the graphs of the square wave and the Fourier sine series with 4 and 16 terms, respectively, have been plotted.
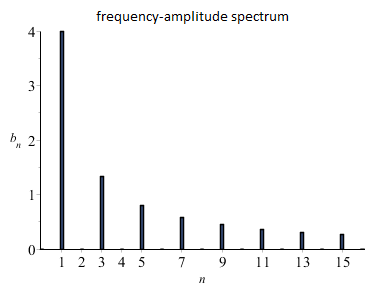
The frequency-amplitude spectrum is shown below: You can see at a glance that the even Fourier sine coefficients are zero and that the frequency levels decrease with increasing \(n\).
You can also use the interactive version below to get an impression of how well the function is approximated by a Fourier series and what the frequency-amplitude spectrum looks like.


