Functions of several variables: Visualisation of functions of two variables
 Level curves and contour plots
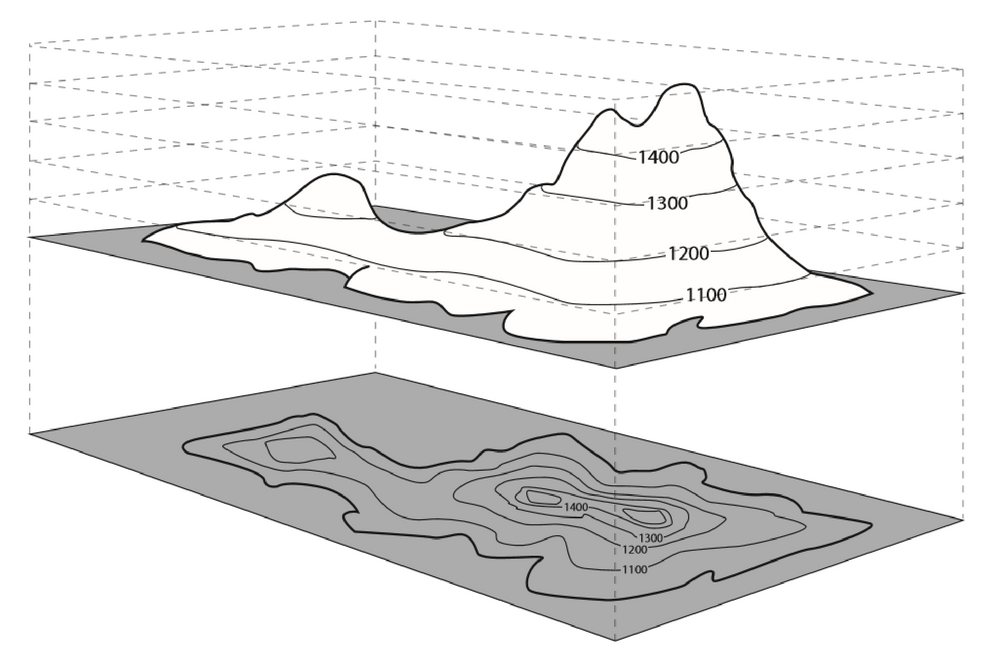
To give an impression of air pressure differences on a weather chart and to give an impression of differences in elevation on a topographic map one often uses level curves. Curves with equal air pressure are called isobars. Elevation curves on a topographic map are curves that represents points with equal elevation in the landscape. The figure below illustrates the construction of an elevation map, where the level curves in the drawing (top) of the landscape are projected on a topographic map (below) as contour curves:

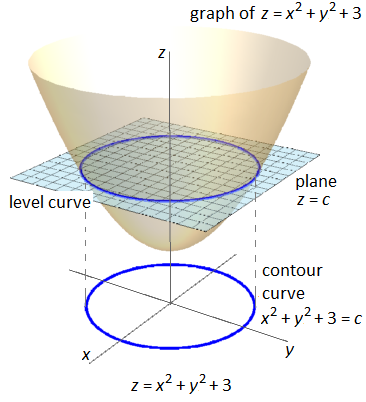
But this construction could also be applied to a surface plot of a function of two variables . Then we speak of isolines or level curves. They are defined as curves in the graph of a function of two variables, say \(z=f(x,y)\), with constant function values. In other words, they are points on the surface plot where the function has the same level. On such a curve \(z=f(x,y)\) is constant. The projection on the \(xy\)-plane is called a contour curve. The figure below illustrates how a contour curve of the function \(f(x,y)=x^2+y^2+3\) is constructed.

We give a few examples.
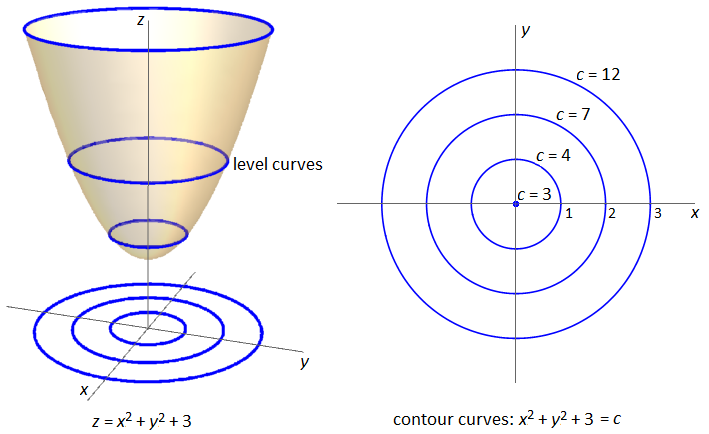
Example 1 On the left-hand side of the figure below, the graph and some level curves of the function \(f(x,y)=x^2+y^2+3\) are plotted, and on the right-hand side the corresponding contour curves are shown; together the contour curves form the contour plot of the function \(f(x,y)\).

The interactive version below may increase your insight in the construction of contour graphs.
Example 2 The contour plot of the function \(f(x,y)=4-x-y\) consists of parallel lines.
Visualization software often provides tools to plot level curves on the surface plot of a function of two variables.
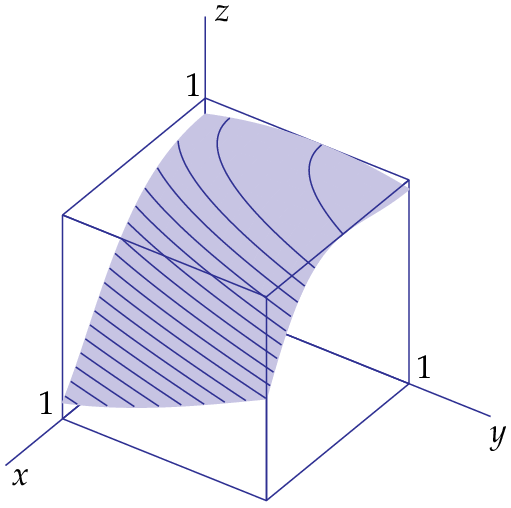
Example 3 In the figure below, level curves are plotted on the surface graph of the function \(z=\tfrac{1}{2}(1-\sin(2x^2-y-1)\) for level \(z=1.00, z=0.95, z=0.90, \ldots\).

Let us have a closer look at the projection of one of the level curves on the \(xy\)-plane, namely of the level curve with value \(1\). Then: \[\tfrac{1}{2}(1-\sin(2x^2-y-1)=1\] This gives the following equation after some formula manipulation: \[\sin(2x^2-y-1)=1\] Within the chosen coordinate system we have found \[2x^2-y-1=-\tfrac{1}{2}\pi\] and thus \[y = 2x^2+\tfrac{1}{2}\pi-1\] The contour curve is a parabola.


