Functions of several variables: Visualisation of functions of two variables
 Matlab exercises: 3D graphics
Exercise 1
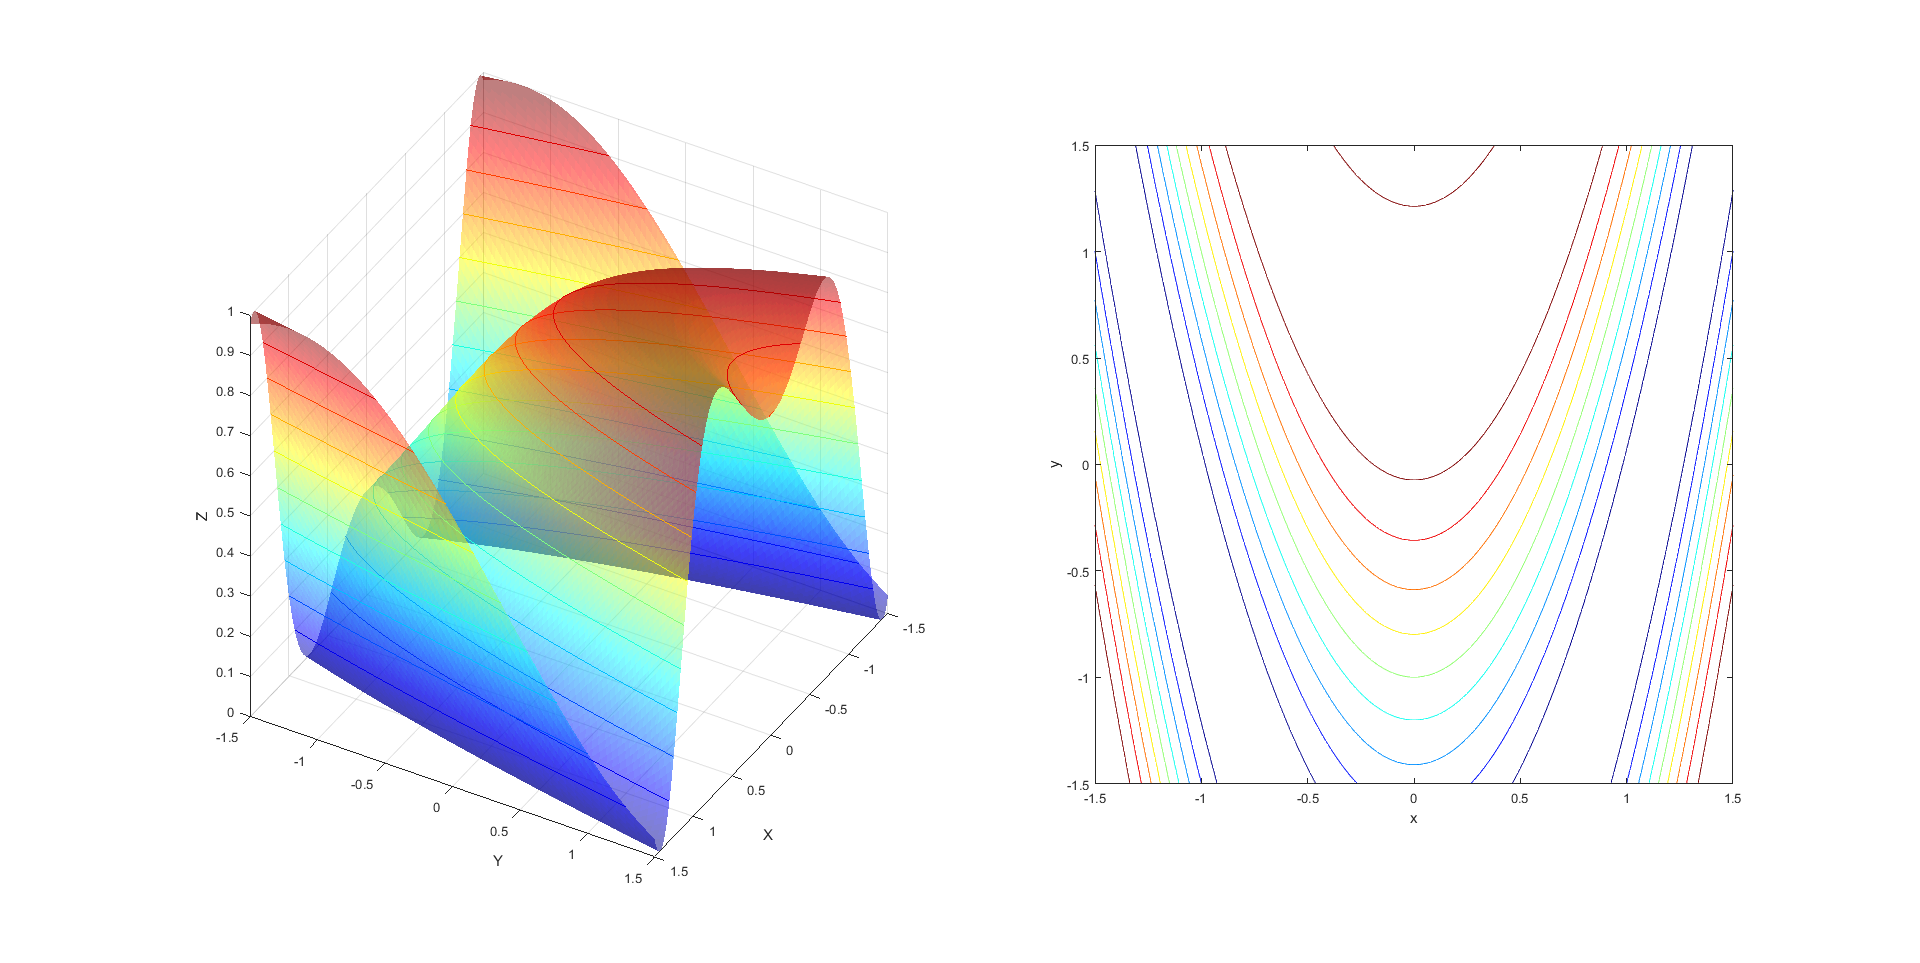
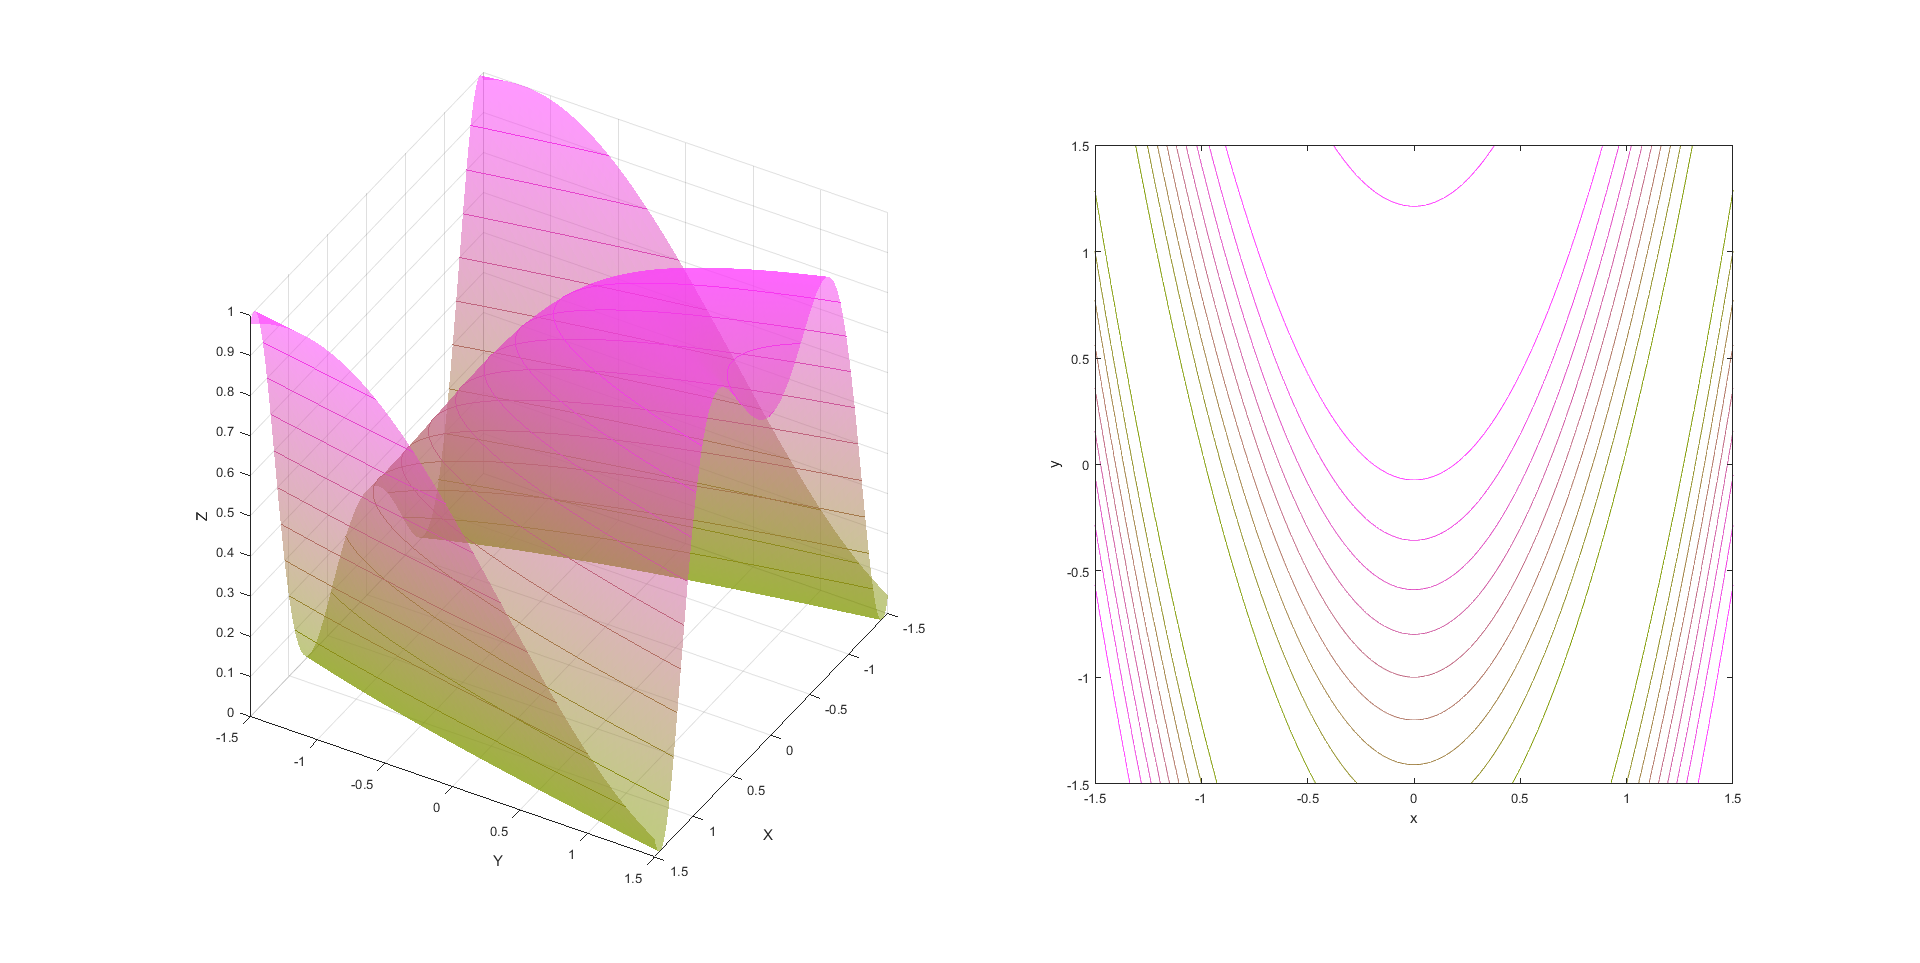
Construct in Matlab the graph (including level curves on the surface) and the contour plot of the function \[f(x,y)=\tfrac{1}{2}\!\bigl(1-\sin(2x^2-y-1)\bigr)\] Play with the 'colormap' (this need not be the same as shown below) and the value of 'Face Alpha.

If you like, you can also make yourself a 'colormap' (search on the Internet). Hint: in the example below a matrix with three columns is created of which column 1, 2 and 3 are the R, G, and B values, respectively. To fill a column, you can for instance use commands like linspace, zeros and ones.

Exercise 2
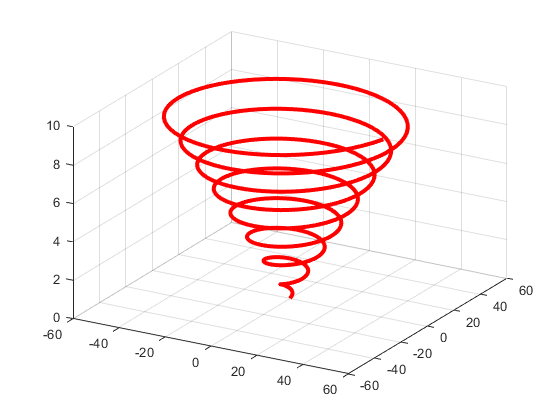
Plot the graph of the parametric curve \[f(t)=(t\cos t, t\sin t, \tfrac{1}{5}t)\] on the interval \([0,50]\), which looks as follows:

Unlock full access


