Systems of differential equations: Linear systems of differential equations
 Coupled autonomous differential equations
In this theory page we will look at some examples of coupled autonomous linear first-order differential equations and we will discuss different behaviours of solutions.
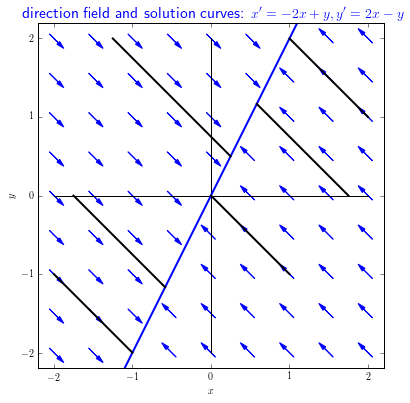
Example 1 The following linear system of differential equations \[\left\{\begin{aligned} \frac{\dd x}{\dd t} &= -2x+ y\\[0.25cm] \frac{\dd y}{\dd t} &= 2x - y\end{aligned}\right.\] has infinitely many equilibria, namely, all points on the straight line with equation \(y=2x\). After all, then \(\dfrac{\dd x}{\dd t}=0\) and \(\dfrac{\dd x}{\dd t}=0\). By adding both GDVs we find that \[\frac{\dd x}{\dd t}+\frac{\dd y}{\dd t}=0\] , and thus \[\frac{\dd(x+y)}{\dd t}=0\] Thus: \[x+y=\text{constant}\] This means that each initial value problem with initial values \(x_0\) and \(y_0\) has solutions such that the parameter curve \(t\mapsto \bigl(x(t), y(t)\bigr)\) is a half-line with equation \(y=-x+x_0+y_0\). For large \(t\) this parameter curve approaches the point \(\bigl(\tfrac{1}{3}(x_0+y_0),\tfrac{2}{3}(x_0+y_0)\bigr)\). All equilibria of the system of differential equations are attracting. In the direction field below, with a few solution curves drawn in the phase plane, the above findings can be recognized.

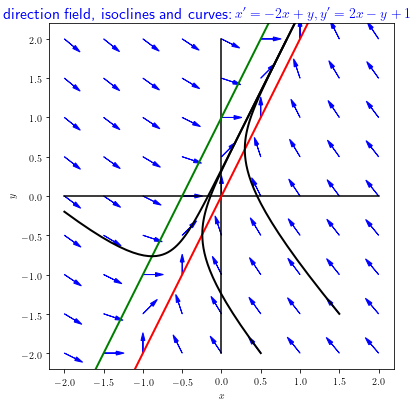
Example 2 The following linear system of differential equations \[\left\{\begin{aligned} \frac{\dd x}{\dd t} &= -2x+ y\\[0.25cm] \frac{\dd y}{\dd t} &= 2x - y+1\end{aligned}\right.\] is similar to that of the previous example, but differs only in the second equation in which a constant term is added. Now there exist no equilibria. In the direction field below, with a few solution curves drawn in the phase plane, the above findings can be recognized.
In this diagram we have drawn the \(x\)-nullcline in red, that is to say, the points for which \(\dfrac{\dd x}{\dd t}=0\) or, in other words, the points in which the arrows are vertical. In green The \(y\)-nullcline is drawn in green, that is to say, the points for which \(\dfrac{\dd y}{\dd t}=0\) or, in other words, the points in which the arrows are horizontal. These nullclines separate regions in which arrows change in the horizontal or vertical direction. For instance, in this example, curves on the left-hand side of the red \(x\)-nullcline go to the right and curves on the right-hand side the red \(x\)-nullcline go to left. Curves above the green \(y\)-nullcline go downward and curves below the green \(y\)-nullcline go upward. The isoclines help analyse the time course of curves qualitatively.
The curves plotted in black give the impression that solution curves approach a straight line in the course of time. This is true and one can prove that the equation of this line is equal to \(y=2x+\dfrac{1}{3}\) and that this line is also a solution curve.

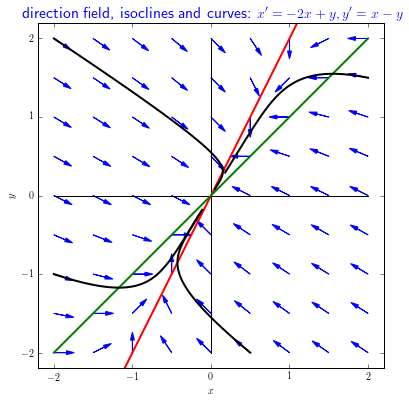
Example 3 The following linear system of differential equations \[\left\{\begin{aligned} \frac{\dd x}{\dd t} &= -2x+ y\\[0.25cm] \frac{\dd y}{\dd t} &= x - y\end{aligned}\right.\] is similar to that of the previous example, but differs only in the second equation in which a coefficient has been changed from \(2\) to \(1\). Now there is just one equilibrium, namely the origin of the coordinate system.
In the direction field below we have drawn some solution curves in the phase plane, and all of them go in the direction of the equilibrium. It is therefore an attracting equilibrium. In the direction field we have drawn in red the \(x\) nullcline, that is, the points for which \(\dfrac{\dd x}{\dd t}=0\) or, in other words, the points in which the arrows are vertical. In green is the \(y\)-nullcline, that is, the points for which \(\dfrac{\dd y}{\dd t}=0\) or, in other words, the points in which the arrows are horizontal. These nullclines separate regions in which arrows change the horizontal or vertical direction. For instance, in this example, curves on the left-hand side of the red \(x\)-nullcline go to the right and curves on the right-hand side the red \(x\)-nullcline go to left. Curves above the green \(y\)-nullcline go downward and curves below the green \(y\)-nullcline go upward. The isoclines help analyse the time course of curves qualitatively.

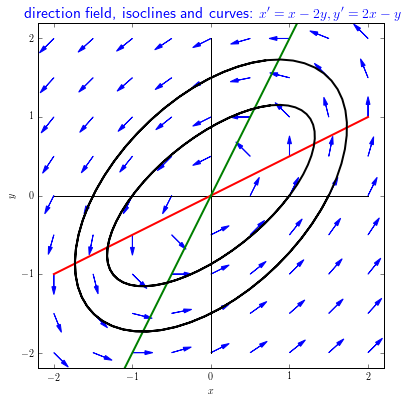
Example 4 The following linear system of differential equations \[\left\{\begin{aligned} \frac{\dd x}{\dd t} &= x-2y\\[0.25cm] \frac{\dd y}{\dd t} &= 2x-y\end{aligned}\right.\] is similar to the last example, in the sense that there is exactly one equilibrium, namely, the origin of the coordinate system. Again the system only differs from the first example in the first equation. In the direction field below some solution curves are shown in the phase plane and they all go counter clockwise along an ellipse. The equilibrium \((0,0)\) itself is a solution around which all solution curves move in the phase plane.
In this diagram we have also drawn the \(x\)-nullcline in red, that is to say, the points for which \(\dfrac{\dd x}{\dd t}=0\) or, in other words, the points in which the arrows are vertical. The \(y\)-nullcline is drawn in green, that is to say, the points for which \(\dfrac{\dd y}{\dd t}=0\) or, in other words, the points in which the arrows are horizontal. These nullclines separate regions in which arrows change the horizontal or vertical direction. For instance, in this example, curves on the left-hand side of the red \(x\)-nullcline go to the right and curves on the right-hand side the red \(x\)-nullcline go to left. Curves above the green \(y\)-nullcline go downward and curves below the green \(y\)-nullcline go upward. The isoclines help analyse the time course of curves qualitatively.


