Systems of differential equations: Non-linear differential equations
 The phase plane
For linear systems of first-order differential equations we have introduced concepts like phase plane, phase portrait, direction field, isoclines, and equilibrium. These can also be used for non-linear systems of first-order differential equations, for example, for systems of differential equations of the form \[\left\{\begin{aligned} \dfrac{\dd x}{\dd t} &= f(x,y)\\[0.25cm] \dfrac{\dd y}{\dd t} &= g(x,y)\end{aligned}\right.\] in the plane, where \(f\) and \(g\) are "neat" functions (here, "neat" means that derivatives exist and are continuous functions).
Initial value problem With a given choice of \((x_0,y_0)\in \mathbb{R}^2\), there is exactly one curve \(t\mapsto \bigl(x(t),y(t)\bigr)\) that satifies to this system, and for which \(\bigl(x(0),y(0)\bigr)=(x_0,y_0)\).
Equilibrium If \(f(x_0,y_0)=g(x_0,y_0)=0\) then \((x_0,y_0)\) is called a singular point, and also a equilibrium, and then this curve is constant: \(\bigl(x(t),y(t)\bigr)=(x_0,y_0)\) for all \(t\). When \((x_0,y_0)\) is not a singular point, then the function \(t\mapsto \bigl(x(t),y(t)\bigr)\) is not constant (that is, really a curve instead of a point) and this curve is called the solution curve through \((x_0,y_0)\).
Phase portrait Often, one draws a number of solution curves in one diagram, and something like this is then called a phase portrait. Usually one also draws then the vector field associated with the 2-dimensional system of differential equations. At each point \((x,y)\) in the phase portrait we can compute the vector \(\cv{x'\\y'}\) as \(\cv{f(x,y)\\g(x,y)}\) and draw it in the plane. Often one pays attention to the set of points in the plane where the vector \(\cv{x'\\y'}\) is constant, the so-called isoclines. Especially one considers \(\boldsymbol{x}\)-nullclines and \(\boldsymbol{y}\)-nullclines, that is, points for which \(\frac{\dd x}{\dd t}=0\) and\(\frac{\dd y}{\dd t}=0\), respectively. Singular points are intersections of \(x\)-nullclines and \(y\)-nullclines.
Lotka-Volterra equation
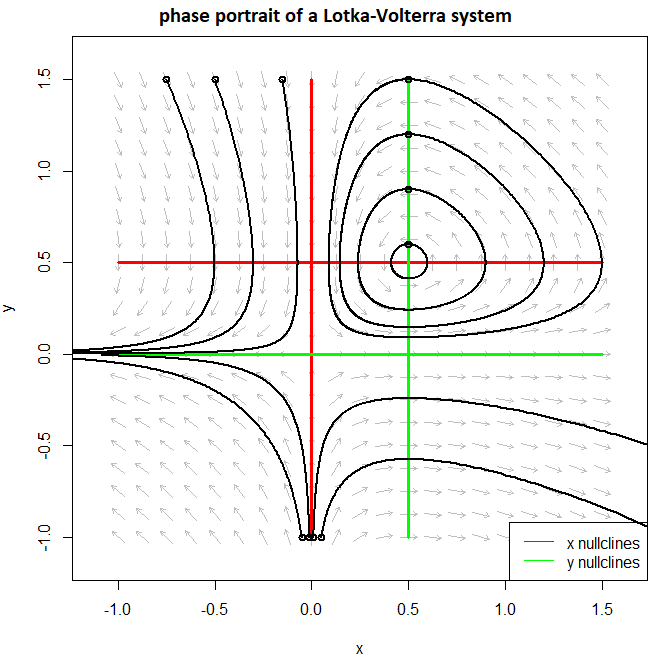
We consider a Lotka-Volterra system, used for example in predator-prey models: \[\left\{\begin{aligned} \dfrac{\dd x}{\dd t} & =a x-b x y\\[0.25cm] \dfrac{\dd y}{\dd t} & =-c y+d x y\end{aligned}\right.\] As example we take \(a=c=1\) and \(b=d=2\). The phase portrait below illustrates that there are various solution curves: periodic trajectories in the first quadrant catch the eye. The periodic orbits go around the equilibrium \((\tfrac{1}{2},\tfrac{1}{2})\). If you are in such a periodic orbit and there occurs a disturbance, then you go to a periodic orbit with another 'amplitude'. The equilibrium \((0,0)\) is a saddle point. When \(x\) and \(y\) are variables which only have nonnegative values, then this saddle point is not so interesting. The red lines represent the \(x\)-nullclines, that is, the points where the direction of solution curves is vertical, and the green lines form the \(y\)-nullclines, that is, the points where the direction of solution curves is horizontal.

Van der Pol equation
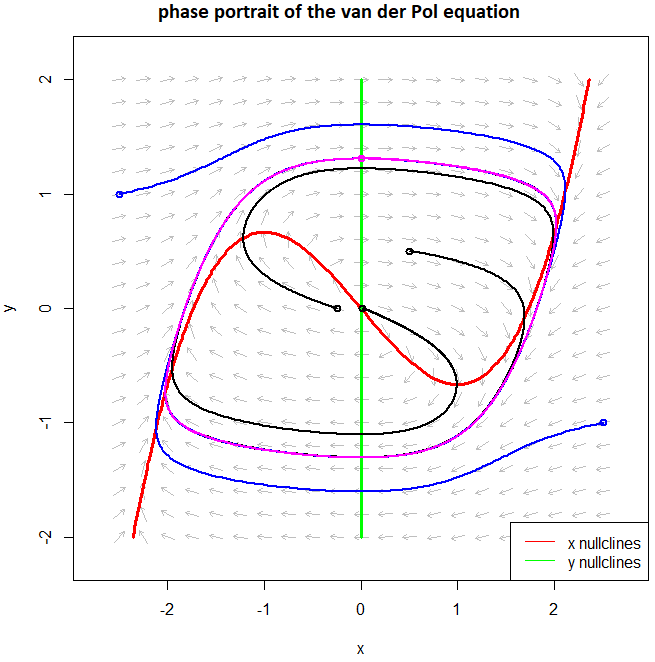
We consider the Van der Pol equation \[\left\{\begin{aligned} \dfrac{\dd x}{\dd t} & =\frac{1}{\varepsilon}\left(y+x-\frac{x^3}{3}\right)\\[0.25cm] \dfrac{\dd y}{\dd t} & =-\varepsilon x\end{aligned}\right.\] with \(0<\varepsilon\ll 1\). As example we choose a fairly large value \(\varepsilon=\tfrac{1}{2}\) in order to show more clearly what happens. The phase portrait below illustrates that there now exists another type of solution curve, namely the limit cycle. This is a periodic trajectory, here drawn in the colour magenta, to which solutions curves converge. We have drawn in the figure below two types of solution curves: three curves converge from the inside to the limit cycle (black curves), and two curves converge from the outside to the limit cycle (blue curves). A small perturbation of the system does not really matter because the solution curve obviously converges then back to the limit cycle. The red lines represent the \(x\)-nullclines, that is, the points where the direction of solution curves is vertical, and the green lines form the \(y\)-nullclines, that is, the points where the direction of solution curves is horizontal.

Interactive computer version of a phase portrait You can also play with the following interactive computerversion of a phase portrait of a non-linear system of differential equation with a parameter \(a\).
In this section we will look again at the behaviour of solutions near an equilibrium.


