Systems of differential equations: Non-linear differential equations
 Action potentials in nerve cells: the Fitzhugh-Nagumo model
Simulation of the Fitzhugh-Nagumo model
The Fitzhugh-Nagumo model is an example of a two-dimensional dynamic system that is relatively simple and essentially has the same behaviour as the renowned Hodgkin-Huxley model about action potentials. There are two variables: one is voltage \(v\), which can change rapidly, and one is a slowly changing variable \(w\) which can 'take care' of recovery after a voltage change. It is non-linear system of differential equations: \[\begin{aligned}\frac{\dd v}{\dd t} &= f(v) - w + {I_{{\rm{stim}}}}\\[0.25cm] \frac{\dd w}{\dd t} &= \varepsilon \cdot (v + \beta - \gamma \cdot w)\end{aligned}\] where \(\varepsilon\) is a very small parameter, and \(f\) is some suitable function.
Traditional parameter values are: \[f(v) = v - {\tfrac{1}{3}}{v^3}\quad \varepsilon = 0.08\quad \beta = 0.7\quad \gamma = 0.8\] We consider two cases: no stimulus \(I=0\) and with a current stimulus \(I=1\). We look at the behaviour of solutions.
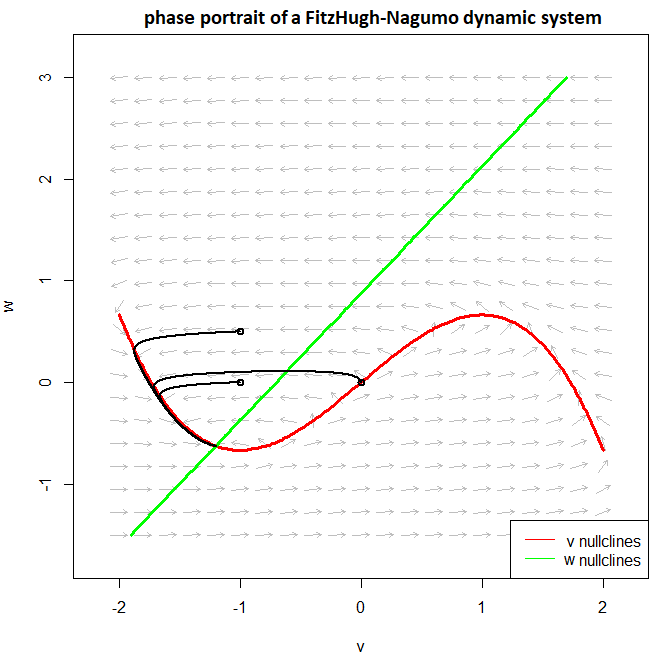
No stimulus Consider \[\begin{aligned}\frac{\dd v}{\dd t} &= f(v) - w \\[0.25cm] \frac{\dd w}{\dd t} &= \varepsilon \cdot (v + \beta - \gamma \cdot w)\end{aligned}\] To draw and understand the phase portrait, we look at the \(v\)-isoclines, i.e. points in the \(v-w\) plane where \(v'=0\) or in other words where the vector arrows in the vector field are vertical. This is the graph of the cubic function \(w=f(v)=v - {\tfrac{1}{3}}{v^3}\). We also look at the \(w\)-isoclines, i.e. the points in the \(w-v\) plane where \(w'=0\), or in other words where the vector arrows in the vector field are horizontal. This is a straight line with equation \(v + \beta - \gamma \cdot w\), i.e. the graph of the linear function \(w = \frac{1}{\gamma}v + \frac{\beta}{\gamma}\). These nullclines are shown in the following phase portrait to show that solution curves approach the \(v\)-nullcline. The equilibrium of this non-linear system can be found by determining the point of intersection of the two graphs, that is to say, by solving the system \(\{w=f(v), w = \frac{1}{\gamma}v + \frac{\beta}{\gamma}\}\). With the given parameter values \(\beta\) and \(\gamma\) there exists an equilibrium in \((v,w)\approx (-1.2,-0.6)\). In the phase portrait below we have drawn solution curves and these curves approach the equilibrium.

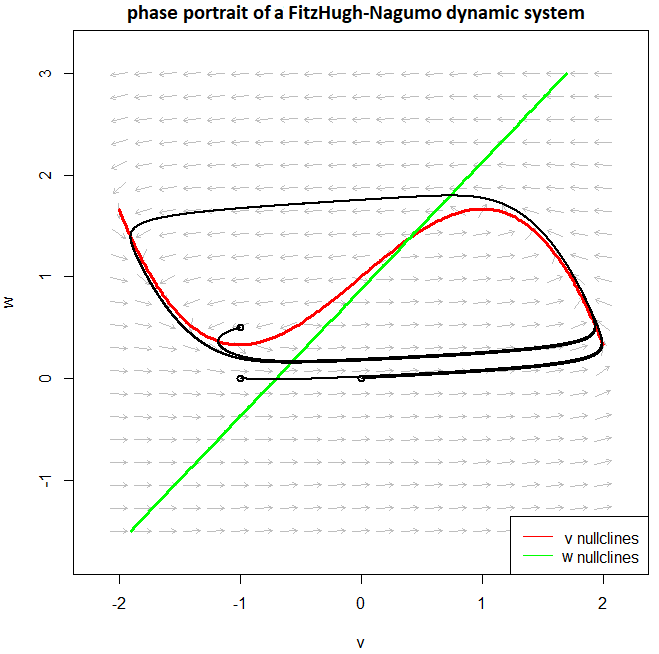
A sufficiently large current stimulus Consider \[\begin{aligned}\frac{\dd v}{\dd t} &= f(v) - w +1 \\[0.25cm] \frac{\dd w}{\dd t} &= \varepsilon \cdot (v + \beta - \gamma \cdot w)\end{aligned}\] To draw and understand the phase portrait, we look at the \(v\)-isoclines, i.e. points in the \(w-v\) plane where \(v'=0\) or in other words where the vector arrows in the vector field are vertical. This is the graph of the cubic function \(w=f(v)=v - {\tfrac{1}{3}}{v^3}+1\). This is actually the graph of the cubic curve in the previous example shifted in the vertical upward direction by a distance 1.We also look at the \(w\)-isoclines, i.e. the points in the \(w-v\) plane where \(w'=0\), or in other words where the vector arrows in the vector field are horizontal. This is a straight line with equation \(v + \beta - \gamma \cdot w\), which is the graph of the linear function \(w = \frac{1}{\gamma}v + \frac{\beta}{\gamma}\). This is the same straight line as in the previous example. These nullclines are shown in the following phase portrait to show that solution curves approach a limit cycle. The equilibrium of this non-linear system can be found by determining the point of intersection of the two graphs, that is to say, by solving the system \(\{w=f(v), w = \frac{1}{\gamma}v + \frac{\beta}{\gamma}\}\). With the given parameter values \(\beta\) and \(\gamma\) there is an equilibrium in \((v,w)\approx (0.4,1.4)\). In the phase portrait below we have drawn solution curves and these curves approach the limit clycle, which is a is a periodic orbit around the equilibrium. At a constant, sufficiently high stimulus, the membrane voltage will be a periodic function in time.

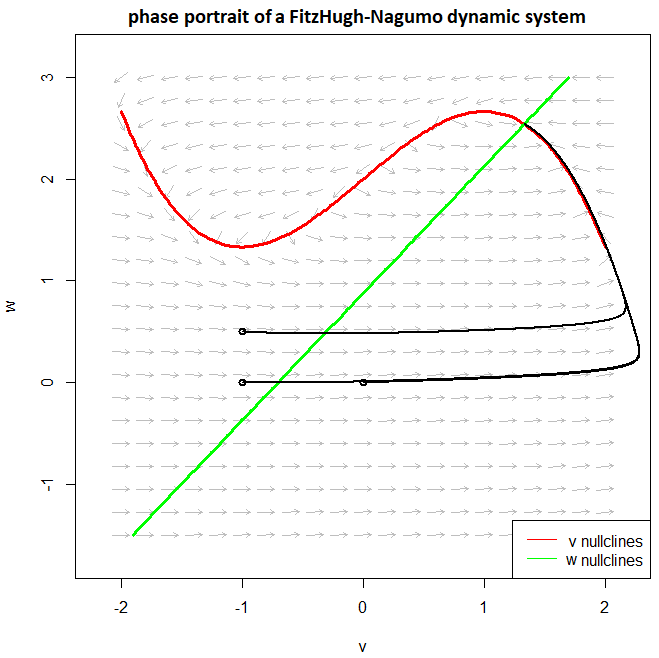
Full analysis We now consider the stability of the balance as a function of stimulus intensity \(I\) for dynamic system \[\begin{aligned}\frac{\dd v}{\dd t} &= f(v) - w + {I_{{\rm{stim}}}} \\[0.25cm] \frac{\dd w}{\dd t} &= \varepsilon \cdot (v + \beta - \gamma \cdot w)\end{aligned}\] If there is no stimulus, there is an attracting equilibrium. If the stimulus \({I_{{\rm{stim}}}}\) is small enough, that is, the graph of the cubic function is shifted a little bit vertically such that the intersection of the straight line and the cubic curve stays to the left of the minimum of the cubic function, then we still have an attracting equilibrium. Only when the stimulus is so large that the point of intersection gets between the local minimum and maximum of the cubic function, then the solutions move toward a limit cycle around the equilibrium. When the stimulus gets larger (for example, \(I_{{\rm stim}}=1.5\) and the point of intersection gets to the right of the local maximum of the third-degree function, then the equilibrium becomes again an attracting equilibrium, and we have a so-called 'excitation blockade'.


