Gene regulation: Dynamical system for proteins
 Gene expression with positive feedback
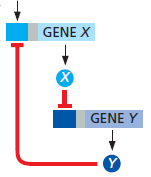
A simple model for positive feedback is represented by the following scheme [cf. Figure 8-80C in Alberts et al. (2015, 6th Edition, p. 515)] with two inhibitory regulatory proteins X and Y.

Due to an input signal the expression of the gene X into the protein X starts. This formed protein is an inhibitory transcription factor for the gene Y, which in turn forms a protein Y that acts as an inhibitory regulatory protein for the transcription of gene Y.
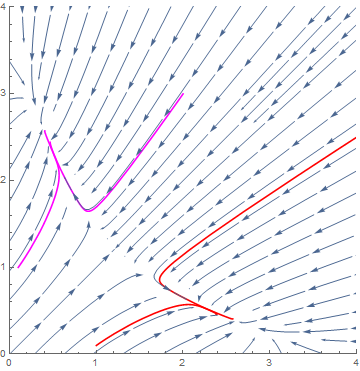
In the example we assume that for each gene, two regulatory proteins can bind to the promoter of the gene. By using the previous formulas for gene expression, we come to the following set of differential equations for the proteins X and Y: \[\begin{aligned}\frac{\dd[\text{X}]}{\dd t}&=\frac{V_\text{X}\cdot K_\text{Y}}{K_\text{Y}+[\text{Y}]^2}-\frac{[\text{X}]}{\tau_\text{X}}\\ \\ \frac{\dd[\text{Y}]}{\dd t}&=\frac{V_\text{Y}\cdot K_\text{X}}{K_\text{X}+[\text{X}]^2}-\frac{[\text{Y}]}{\tau_\text{Y}}\end{aligned}\] By scaling we can reduce the system of differential equations to the following system of two quantities \(u\) and \(v\) that are associated with the scaled concentrations of X and Y: \[\begin{aligned} \frac{\dd u}{\dd t}&= \frac{\alpha}{1+v^2}-u\\ \\\frac{\dd v}{\dd t}&= \frac{\beta}{1+u^2}-v\end{aligned}\] We now assume that \(\alpha=\beta=3\). The following phase portrait, in which we draw four solution curves, shows that there are now three singular points: one repelling equilibrium (on the line \(u=v\) near \((1.21, 1.21)\) ) and two attracting equilibria nearby ( \((2.62, 0.38)\) and \((0.38, 2.62)\) ).

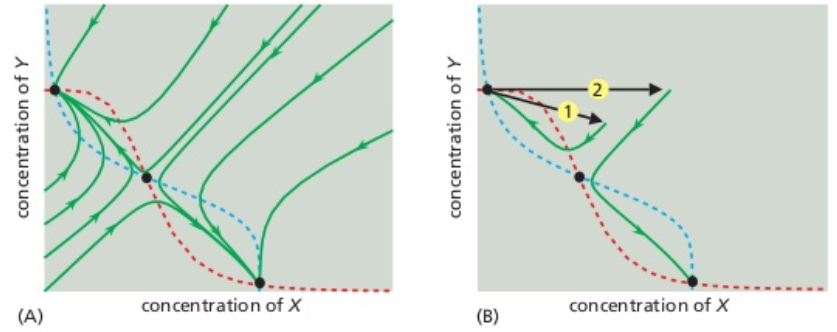
If the system is in one of the attracting equilibrium, then the network will return to the equilibrium after a small perturbation. Only a large perturbation may lead to a change in stability. Suppose you are in the equilibrium \((0.38, 2.62)\) and the concentration of the protein Y increases suddenly very much: this means that you shift horizontally to a new point in the phase portrait. When the translation is large enough and you compute the solution of the system of differential equations from that point onward, then the solution curve goes to the other equilibrium. So, in this network of positive feedback you can switch from one to another stable state.
The below figure 8-82 from Alberts et al. (2015, 6th Edition, p. 519) illustrates the above analysis. The dotted lines in this figure represent the curves defined by the equations \(\frac{\alpha}{1+u^2}=v\) (red) and by \(\frac{\beta}{1+v^2}=u\) (blue). The intersection of these two curves are the singular points.

By the way, the number of singular points in this example depends on the values of \(\alpha\) and \(\beta\): when we choose \(\alpha=\beta\le 2\), there is only one attracting equilibrium.
Play with the simulation below to study the behaviour of solutions. It gives the concentration profile of \(u\) and \(v\) for the system \[\begin{aligned} \frac{\dd u}{\dd t}&= \frac{\alpha}{1+v^2}-u\\ \\\frac{\dd v}{\dd t}&= \frac{\alpha}{1+u^2}-v\end{aligned}\] with different initial values and you can also vary \(\alpha\).


