Bioelectricity: Electric excitability and action potential
 Voltage-dependent conductivity of potassium channels
Measurements of Hodgkin and Huxley in voltage-clamp experiments
The diagram below shows the points measured by Hodgkin and Huxley in their voltage-clamp experiments in which the conductivity of potassium channels for various imposed voltages are plotted in the course of time (always in their own coordinate systems). Recall that this is always a step-wise increases in the imposed voltage (as noted on the right-hand side of the curves) and involves the reaction of the membrane hereto. For the conductivity \(g_\mathrm{K}\) we have: \[g_\mathrm{K}=\frac{V_m-E_\mathrm{K}}{I_\mathrm{K}}\] i.e. \[I_K=g_K(V_m-E_\mathrm{K})\] The measured data at an imposed voltage are always modelled with a mathematical formula of which the graph is drawn. The graphs describe the measured data quite well.

Normalization of conductivity
The graph of the conductivity \(g_\mathrm{K}\) of potassium channels appears with increasing voltage increasingly similar to a sigmoidal curve. But when you normalize these graphs they are in fact all of this form (see the diagram below). Normalization is actually nothing more than writing the conductivity \(g_\mathrm{K}\) as the product of the maximum conductivity, say \(\overline{g_\mathrm{K}}\), and a function \(p_\mathrm{K}(t)\): \[g_\mathrm{K}=\overline{g_\mathrm{K}}\cdot p_\mathrm{K}(t)\] This function \(p_\mathrm{K}(t)\) is the normalized conductivity of potassium channels. This enabled Hodgkin and Huxley to propose a formula for conductivity of potassium channels as a function of voltage and time.
Mathematical model
The basic idea is to first establish a mathematical model where \(\overline{g_\mathrm{K}}\) is the maximum conductivity of potassium channels, when all potassium channels are open, and \(p_\mathrm{K}\) symbolizes the fraction of open potassium channels. Hodgkin and Huxley assumed that four components of a potassium channel, also referred to as gating variables of gating particles, must be in permeable mode in order to have ionic flow through the ion channel. The probability that each component is separately permeable was described by Hodgkin and Huxley always via the same function \(n(t)\). They also assumed that the stochastic processes are independent. This gives the formula \[p_\mathrm{K}=n^4\] In analogy with chemical reaction kinetics Hodgkin and Huxley assumed that there is an 'equilibrium reaction' for each of the components from non-permeable to permeable state and vice versa with the 'reaction constants' \(\alpha_n\) and \(\beta_n\) (this name choice will be clarified later) in a model of elementary reactions. So we have a balance \[\text{non-permeable}\rightleftharpoons \text{permeable}\] which actually consists of two simultaneous processes, namely
forward: \(\displaystyle \text{ non-permeable}\stackrel{\alpha_n}{\longrightarrow} \text{permeable}\) with process constant \(\alpha_n\)
backward: \(\displaystyle \text{ permeable}\stackrel{\beta_n}{\longrightarrow} \text{non-permeable}\) with process constant \(\beta_n\)
The process of change is described by the following differential equation \[\frac{\dd n}{\dd t}=\alpha_n\cdot (1-n)-\beta_n\cdot n\] i.e. as \[\frac{\dd n}{\dd t} = - (\alpha_n+\beta_n)n + \alpha_n\] The differential equation is associated with limited exponential growth and has as a solution for the initial value \(n(0)=0\) (chance of permeability equal to 0): \[n(t) = n_\infty\cdot \left(1-\exp\bigl(-\frac{t}{\tau_n}\bigr)\right)\] with steady-state value \( n_\infty\) and time constant \(\tau_h\) given by \[n_\infty = \frac{\alpha_n}{\alpha_n+\beta_n}\quad\mathrm{and}\quad \tau_n=\frac{1}{\alpha_n+\beta_n}\] In the diagram below is show the graph of the function \(n(t)\) in the inset together with the graphs of the functions \(n^2\), \(n^3\) and \(n^4\).

Hodgkin and Huxley based their choice of four components and thus their choice of \(n^4\) solely on the basis of a good agreement of model results with measurements. You could say they have done so only in order to get the best sigmoidal shape. Later, however, from studies of the structure and the functioning of the potassium channel it became clear that there are in fact four components to distinguish. The figure below shows in the bottom left corner the top view of the three-dimensional structure with four identical components of a potassium channel in a mammal, which together form the open or closed cavity for potassium ion current. This work on the structure of ion channels by MacKinnon was awarded the Nobel prize in 2003.

Voltage dependence
Note that the functions \(\alpha_n\) and \(\beta_n\) in the model of Hodgkin and Huxley, and thus also \(n_\infty\) and \(\tau_n\), are dependent on the membrane voltage. What Hodgkin and Huxley therefore still had to do was to make voltage-dependent formulas based on their measurement. They proposed (in units of \(\mathrm{ms}^{-1}\) and \(\mathrm{mV}\)): \[\alpha_n = \frac{0.01(10-v)}{\exp\left(\frac{10-v}{10}\right)-1}\quad\mathrm{and}\quad \beta_n=0.125\exp\left(\frac{-v}{80}\right)\] where \(v\) is the difference between the voltage and the resting membrane voltage \(V_r=-70\;\mathrm{V}\). When you do not want to express the voltage dependency relative to the resting membrane potential but instead study it relative to the membrane potential then you need to replace \(v\) by \(V-V_r=V+70\).
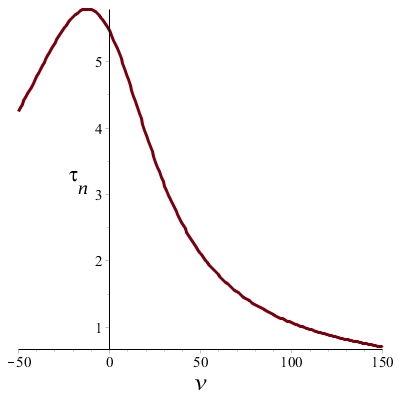
When we apply the above formulas we can plot the time constant \(\tau_n\) and the steady-state value \(n_\infty\) against voltage \(v\) and watch the voltage dependence in graphic form:
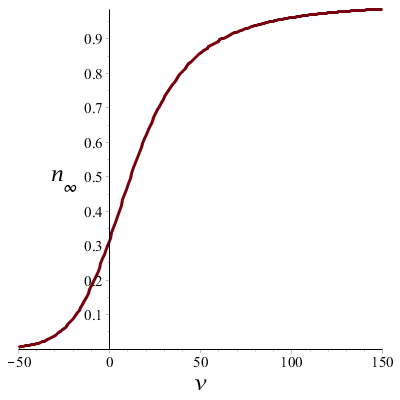
The bottom graph shows that at depolarization (positive \(v\)), the potassium conductivity increases as the voltage becomes larger, and the potassium channel moves toward a permeable state. In case of a strongly negative potential the potassium channel tends to close.
The upper graph shows that in the case of the depolarization the time constant \(\tau_n\) decreases as the voltage increases; in other words, when the depolarization becomes larger, the cell will rapidly 'react' accordingly. The time constant is the highest around the resting membrane potential and decreases on either side.
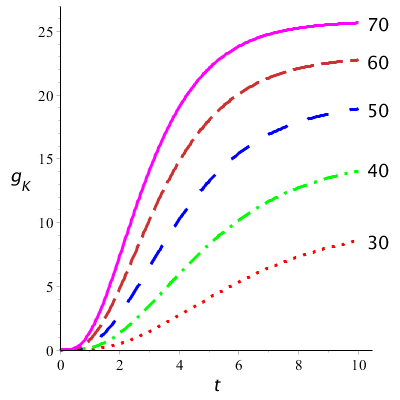
Below are shown graphs of the model curves of potassium conductivity plotted against time for different values of \(v\). We used the following value for the maximum conductivity: \(g_\mathrm{K} =36\;\mathrm{mS\,cm}^{-2}\). They look like the measurement curves in the first diagram made by Hodgkin and Huxley.