Bioelectricity: Electric excitability and action potential
 The model of Hodgkin and Huxley in all its glory
We are now ready to explore the model of Hodgkin and Huxley applied to a giant axon of a squid in all its glory. We apply it to a short but constant current stimulus. The model consists of four coupled differential equations with voltage-dependent parameters that are associated with the gate mechanisms of potassium and sodium channels. For completeness, other parameters are also listed in the table below so that everyone can imitate the calculation with a sufficient powerful mathematical software. For the resting membrane potential we haven taken \(V_r=-70\;\mathrm{mV}\).
Model equations of Hodgkin and Huxley
\[\begin{aligned} C_m\frac{\dd V_m}{\dd t} &= -\overline{g_\mathrm{K}}n^4(V_m-E_\mathrm{K})-\overline{g_\mathrm{Na}}m^3h(V_m-E_\mathrm{Na})-\overline{g_\mathrm{L}}(V_m-E_\mathrm{L})+I\\[0.15cm]
\frac{\dd n}{\dd t}&=\alpha_n(V_m)(1-n)-\beta_n(V_m)n\\[0.15cm]
\frac{\dd m}{\dd t}&=\alpha_m(V_m)(1-m)-\beta_m(V_m)m \\[0.15cm]
\frac{\dd h}{\dd t}&=\alpha_h(V_m)(1-h)-\beta_h(V_m)h \\[0.15cm]
\overline{g_\mathrm{K}}&= 36\;\mathrm{mS\,cm}^{-2} \\[0.15cm]
\overline{g_\mathrm{Na}}&= 120\;\mathrm{mS\,cm}^{-2} \\[0.15cm]
\overline{g_\mathrm{L}}&= 0.3\;\mathrm{mS\,cm}^{-2}\\[0.15cm]
E_\mathrm{K}&= -82\;\mathrm{mV} \\[0.15cm]
E_\mathrm{Na}&= 45\;\mathrm{mV} \\[0.15cm]
E_\mathrm{L}&= -59\;\mathrm{mV}\\[0.15cm]
C_m&= 1\,\mathrm{\mu F\,cm}^{-2}\\[0.15cm]
\alpha_n(v) &= \frac{0.01\bigl(10-(v-V_r)\bigr)}{\exp\left(\frac{10-(v-V_r)}{10}\right)-1}\\[0.15cm]
\beta_n(v)&=0.125\exp\left(\frac{-(v-V_r)}{80}\right)\\[0.15cm]
\alpha_m(v)&= \frac{0.01\bigl(25-(v-V_r)\bigr)}{\exp\left(\frac{25-(v-V_r)}{10}\right)-1}\\[0.15cm]
\beta_m(v)&=4\exp\left(\frac{-(v-V_r)}{18}\right)\\[0.15cm]
\alpha_h(v)&=0.07\exp\left(\frac{-(v-V_r)}{20}\right)\\[0.15cm]
\beta_h(v) &= \frac{1}{\exp\left(\frac{30-(v-V_r)}{10}\right)+1}\\[0.15cm]
\end{aligned}\] As initial values we choose \[V_m=V_r=-70\,\mathrm{mV}, n(0)=0.32, m(0)=0.06, h(0)=0.6\] to make sure that the electric potential without an electric current stimulus remains the same. For the electric current stimulus, we take a rectangular pulse having various heights and durations. Mathematical software can numerically solve the initial value problem and plot solution curves.
A clearer view is obtained when one calculates the membrane potential relative to the resting membrane potential \(V_r\), say \(U=V_m-V_r\), and at same time uses the Nernst potentials relative to the resting membrane potential, say \(U_\mathrm{K}=E_\mathrm{K}-V_r\), \(U_\mathrm{Na}=E_\mathrm{Na}-V_r\) and \(U_\mathrm{L}=E_\mathrm{L}-V_r\). Then the system of differential equations is \[\begin{aligned} C_m\frac{\dd U}{\dd t} &= -\overline{g_\mathrm{K}}n^4(U-U_\mathrm{K})-\overline{g_\mathrm{Na}}m^3h(U-U_\mathrm{Na})-\overline{g_\mathrm{L}}(U-U_\mathrm{L})+I\\[0.15cm]
\frac{\dd n}{\dd t}&=\alpha_n(U)(1-n)-\beta_n(U)n\\[0.15cm]
\frac{\dd m}{\dd t}&=\alpha_m(U)(1-m)-\beta_m(U)m \\[0.15cm]
\frac{\dd h}{\dd t}&=\alpha_h(U)(1-h)-\beta_h(U)h \\[0.15cm]
\overline{g_\mathrm{K}}&= 36\;\mathrm{mS\,cm}^{-2} \\[0.15cm]
\overline{g_\mathrm{Na}}&= 120\;\mathrm{mS\,cm}^{-2} \\[0.15cm]
\overline{g_\mathrm{L}}&= 0.3\;\mathrm{mS\,cm}^{-2}\\[0.15cm]
E_\mathrm{K}&= -82\;\mathrm{mV} \\[0.15cm]
E_\mathrm{Na}&= 45\;\mathrm{mV} \\[0.15cm]
E_\mathrm{L}&= -59\;\mathrm{mV}\\[0.15cm]
C_m&= 1\,\text{µ}\mathrm{F\,cm}^{-2}\\[0.15cm]
\alpha_n(v) &= \frac{0.01(10-v)}{\exp\left(\frac{10-v}{10}\right)-1}\\[0.15cm]
\beta_n(v)&=0.125\exp\left(\frac{-v}{80}\right)\\[0.15cm]
\alpha_m(v)&= \frac{0.01(25-v)}{\exp\left(\frac{25-v}{10}\right)-1}\\[0.15cm]
\beta_m(v)&=4\exp\left(\frac{-v}{18}\right)\\[0.15cm]
\alpha_h(v)&=0.07\exp\left(\frac{-v}{20}\right)\\[0.15cm]
\beta_h(v) &= \frac{1}{\exp\left(\frac{30-v}{10}\right)+1}\\[0.15cm]
\end{aligned}\] As initial values we choose \[U=0\,\mathrm{mV}, n(0)=0.32, m(0)=0.06, h(0)=0.6\] When you want to know hereafter the membrane potential \(V_m\), then you just use the relationship \[V_m=U+V_r\tiny.\]
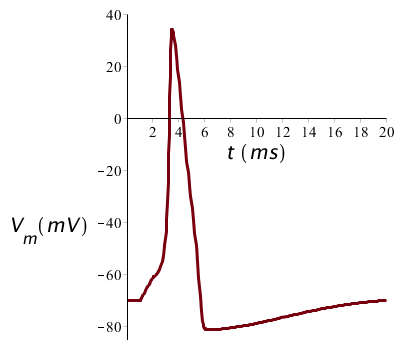
We start with an electric current pulse lasting 1 ms, beginning at time \(t=1\;\mathrm{ms}\) and with a magnitude of 10 µA/cm2. Then we get a single action potential and the graph of the membrane voltage looks as follows:
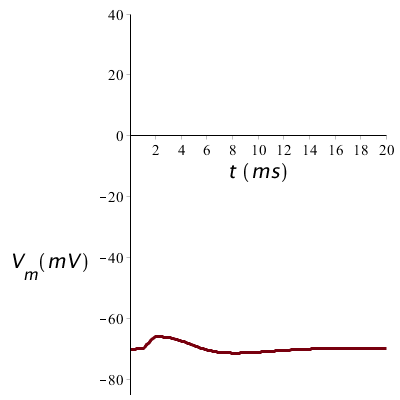
The stimulus of the membrane potential must however be above the firing threshold, otherwise there occurs no action potential. When we halve the stimulus magnitude and therefore only inject a current of 5 µA/cm2, then the threshold is not reached during 1 ms and the potential returns to the resting membrane potential as shown in the figure below.
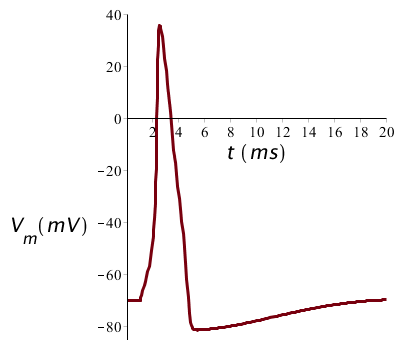
When the stimulus has a sufficient high magnitude to generate an action potential, then its magnitude has little effect on the shape of the action potential. The figure below shows the potential profile at a twice as big stimulus (20 µA/cm2 current during 1ms), but the graph looks just the same as before:
When the stimulus is prolonged, then there can arise a series of spikes: below is shown the membrane potential profile at a constant current stimulus of 10 mA/cm2:
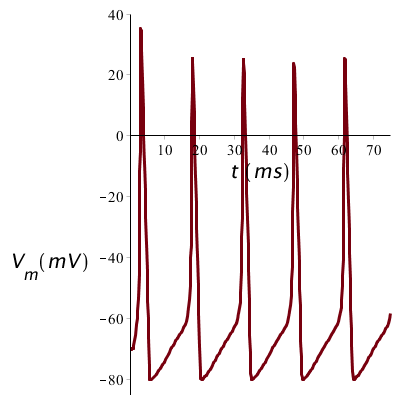
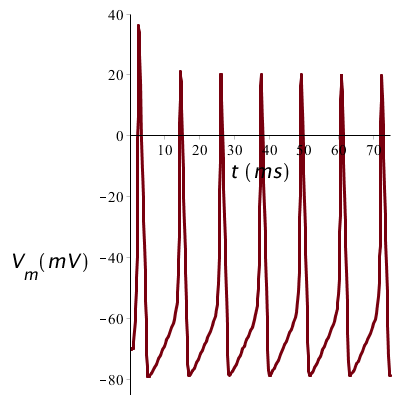
When the long current stimulus is stronger, say 20 µA/cm2 in our sample calculation, the peaks will in essence have the same shape, but they are closer to each other. The strength of a prolonged stimulus is thus translated into the frequency of the spike train.
In order to better follow the processes occurring in the potassium and sodium channels during an action potential, it helps to plot the graphs of \(n(t)\), \(m(t)\) and \(h(t)\). Below are the model curves for our first case of a short current pulse (10 µA/cm2 lasting 1 ms and starting at time \(t=1\;\mathrm{ms}\)).
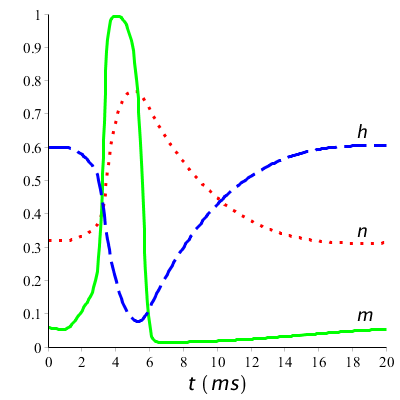
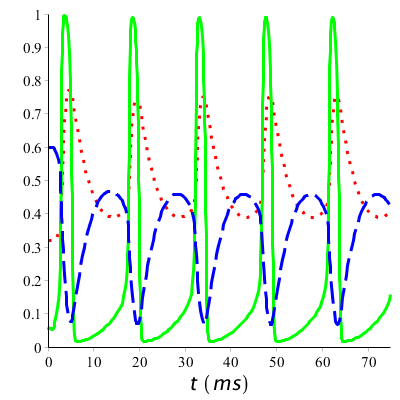
What we see in the graphs is that at the start of the action potential, the value of \(m\) increases fast: sodium channels open. With some delay \(h\) decreases: sodium channels get into an inactived state. Slowly \(h\) will increase again: during a certain period no action potential can be generated anymore or only with great difficulty. Also \(n\) will decrease, all be it with some delay: potassium channels open and close again as the resting potential comes closer again. In a long-term stimulation with a series of spikes, this process is repeated again and again. Below the graphs are drawn during a long-term stimulation above the firing threshold.
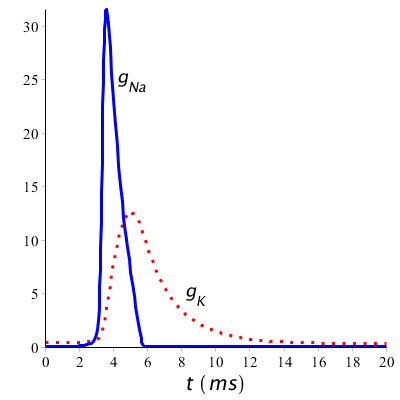
Let us return to the conductivities of the potassium and sodium channels during a short stimulus (with a duration of 1 ms starting at time 1 ms). We see in the diagram below of the changing conductivities during an action potential that in fact first there is an influx of sodium ions into the cell followed by an outflow of potassium ions.
