Trigonometry: Trigonometric functions
 Graphs of trigonometric functions
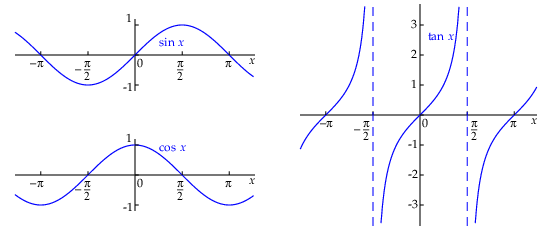
Below, the graphs of the functions \(\sin(x)\) , \(\cos(x)\) and \(\tan(x)\) are plotted.
These functions are periodic: the period of the sine and cosine is equal to \(2\pi\) and the period of the tangent is equal to \(\pi\).
The sine and cosine graphs fluctuate about the equilibrium value \(0\) and the maxium deviation, also called amplitude, is equal to \(1\).
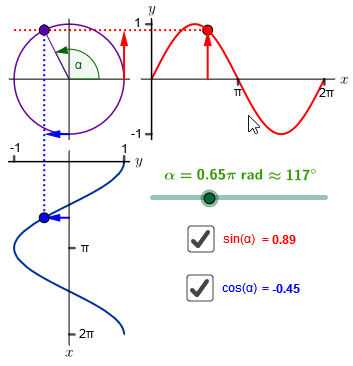
Interactive visualisation of the sine and cosine graph The interactive visualisation below is meant to provide more insight into the graph of the sine and cosine function. The sine graph is drawn in the common orientation (positive \(x\)-axis to the right and upward positive \(y\)-axis); the cosine graph is drawn in a quarter turn (downward positive \(x\)-axis pointing downward and positive \(y\)-axis to the right).
Click on the animation button in the lower-left corner to start and stop an animation. You can also use the mouse to drag the slider and to select functions.
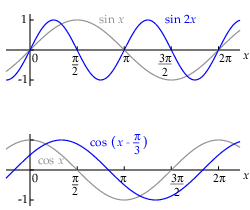
Transformations Below are examples drawn from two much-used transformations. In the top of the two figures you find besides the graph of the function \(\sin(x)\) also the graph of \(\sin(2x)\). The sine graph is in the horizontal direction compressed by a factor of 2. The period has become twice as small: \(\pi\) instead \(2\pi\).
The bottom plot shows next to the graph \(\cos(x)\) also the graph of the function \(\cos(x - \frac{\pi}{3})\). The cosine graph is now translated in the horizontal direction over a distance of \(\frac{\pi}{3}\).
We will discuss transformations of the sine function and its graph in a more systematic way.


