Trigonometry: Trigonometric functions
 Signal analysis
Signal analysis (also called harmonic analysis) is based on the property that each periodic signal \(s(t)\) with period \(T\), and hence with frequency \(f=T^{-1}\), can be written as a possibly infinite sum of sinusoids with frequencies that are a multiple of \(f\), provided that the signal is a sufficiently neat function. We leave open the question what the so-called Dirichlet conditions for neatness are, but all practical signals meet these conditions. So we can write the following for a periodic signal \(s(t)\):
\[\begin{aligned} s(t) &= c + \sum_{n=1}^{\infty} c_n\cdot\sin(2\pi\cdot n\cdot f\cdot t+\varphi_n)\\ \\
&= c + \sum_{n=1}^{\infty} a_n\cdot\cos(2\pi\cdot n\cdot f\cdot t)+\sum_{n=1}^{\infty} b_n\cdot\sin(2\pi\cdot n\cdot f\cdot t)
\end{aligned}\]
The size of the coefficients \(c\), \(a_n\), \(b_n\), and \(c_n\) in this so-called Fourier series can be calculated using Fourier integrals, but we will not go into this. It suffices to note that the sequence \(c_1, c_2, c_3, \ldots\) is called the amplitude spectrum and the sequence \(\varphi_1, \varphi_2, \varphi_3, \ldots\) is called the phase spectrum. The bar chart of the function \(n\mapsto c_n\) is called the amplitude-frequency spectrum of the signal \(s(t)\). The bar chart of the function \(n\mapsto c_n^2\) is called the power spectrum of the signal \(s(t)\); often it is normalized by the total power \(\displaystyle \sum_{n=1}^{\infty}c_n^2\).
The first term \(c_1\sin(2\pi f t+\varphi_1)\) in the signal is called the first harmonic, the second term \(c_2\sin(4\pi f t+\varphi_2)\) is called the second harmonic or first overtone, and so on. If the signal is a sound signal one speaks of a fundamental frequency \(f\) and overtones with frequencies \(n\cdot f\) for \(n=2,3,\cdots\) .
The earlier example of the knee angle during hopping is a simple example of a finite Fourier reeeks, in this case, with only two sinusoids. We discuss two other examples.
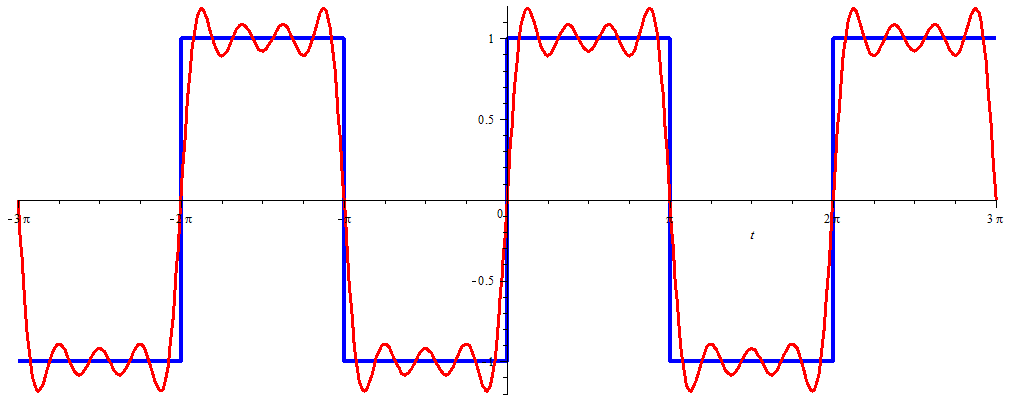
We consider the block signal \(s(t)\) defined as the periodic continuation of the fucntion \[\sigma(t)=\begin{cases} -1 & \text{als \(-\pi\le t<0\)}\\ 1 & \text{als \(0< t\le \pi\)}\end{cases}\]
The Fourier series of this signal is as follows: \[\begin{aligned} s(t) &= \frac{4}{\pi}\sin(t)+\frac{4}{3\pi}\sin(3t) +\frac{4}{5\pi}\sin(5t)+\frac{4}{7\pi}\sin(7t)+\cdots\\ \\
&=\frac{4}{\pi}\sum_{n=1}^{\infty} \frac{\sin\bigl((2n-1)t\bigr)}{2n-1}\end{aligned}\] The below graph shows the block signal and the graph of the sum of the first four terms in the Fourier series.
This example comes from music theory. Two tones sounding simultaneously form an interval. When the frequencies of these tones have a simple vibration ratio, then the composition sounds harmonious. In music theory, there are traditional names in use, such as an octave for the vibration ratio 1 : 2, and a major third for the vibration ratio of 4 : 5.
Let's see what kind of signal is created when we put together two pure sine tones. We consider two signals with frequencies of 440 and 550 Hz. Together they form a major third: \[\begin{aligned} s_1(t) &= \sin(2\pi\cdot 440\cdot t)\\ \\ s_2(t) &= \sin(2\pi\cdot 550\cdot t)\\ \\ s(t) &= s_1(t)+s_2(t)=\sin(2\pi\cdot 440\cdot t)+\sin(2\pi\cdot 550\cdot t)\end{aligned}\]
The graph of the additive signal \(s(t)\) is shown below. The formula can be rewritten as \[s(t)=2\sin(2\pi\cdot 495\cdot t)\cdot \cos(2\pi\cdot 55\cdot t)\] In the diagram below we have also plotted the signals \(\pm\cos(2\pi\cdot 55\cdot t)\).
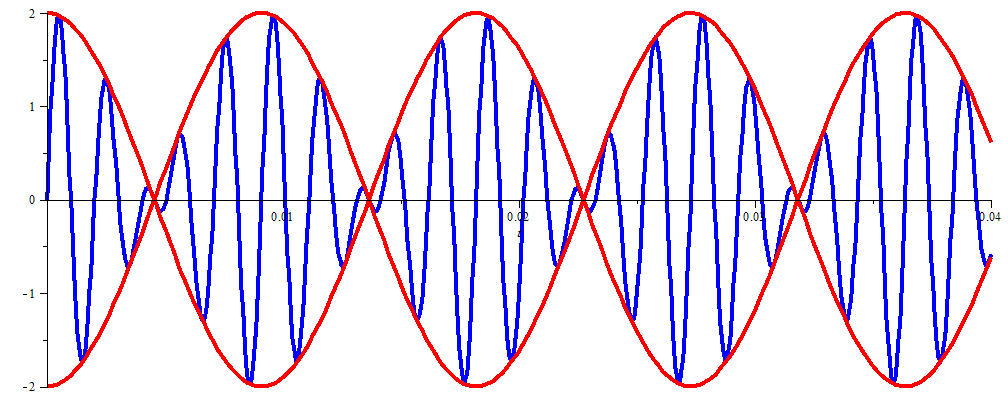
This explains why people besides the constituent tones of 440 Hz and 550 Hz also can hear a (weak) tone of 110 Hz: There are a hundred and ten 'intensity' peaks per second. Less harmonious is the beat which is heard when two approximately equally strong audio signals are composed with frequencies that are little different. A relatively slow vibration can be clearly detected.
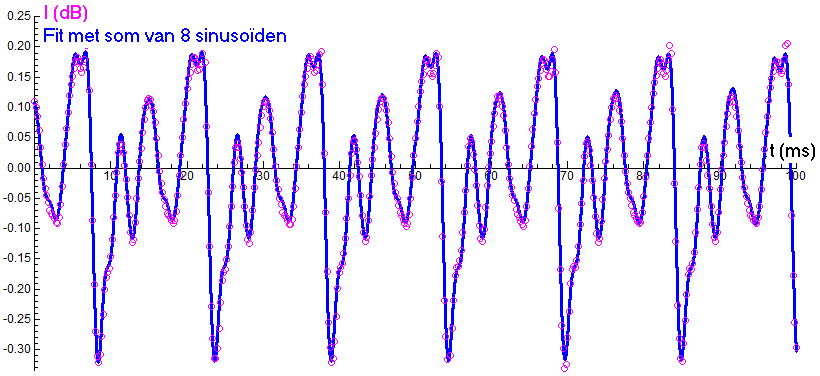
Sounds from musical instruments are usually composed of more than two frequencies. Below is the measurement of a low sound on a baritone saxophone with the proper description of the signal with 8 sinusoids. The frequency-amplitude spectrum of the signal is displayed as a bar graph. The measured frequencies are integer multiples of the fundamental tone C2 (65,406 Hz).
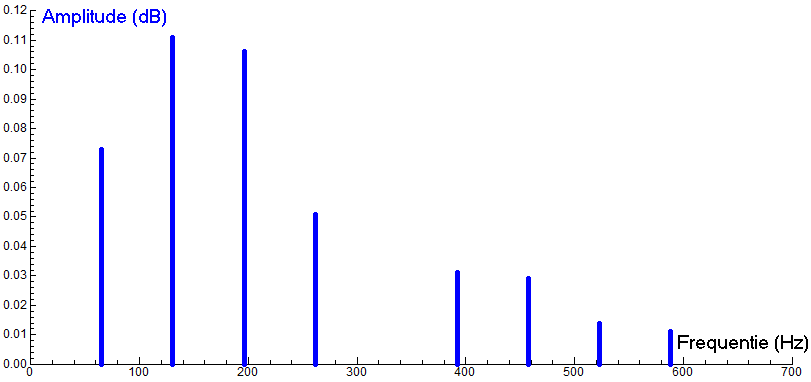
The second last example is an application in speech recognition, where different vowels clearly have different patterns of intensities for the frequency spectrum. The frequencies with the highest intensities are called formants and, for example, the distance between the two or three lowest formants is an important feature to distinguish vowels.
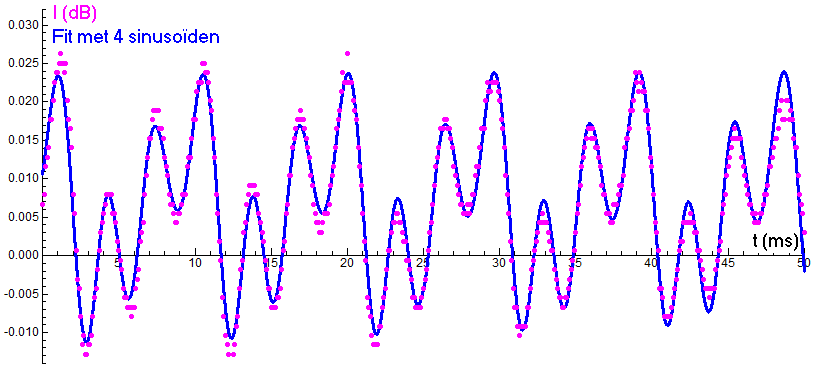
Below is the graph of the short sound measurement of the vowel pronounced as 'ee' together with the proper description of the signal by 4 sinusoids. From the frequency-amplitude spectrum (not shown) it follows that the second formant is a three-fold of the first formant.
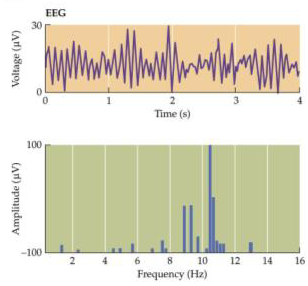
The last example comes from the analysis of electroencephalographic (EEG) signals. These are recordings via the scalp of changes in electrical potential differences in the brains. In EEG spectral analysis, the biosignal is split into contributions from numerous sinusoids; in the power spectrum can be read off which frequencies contribute the most. This spectrum is generated by computer analysis of the measured EEG signal. In the figure below (Figure 2.6b from Purves et al., Principles of Cognitive Neuroscience, 2nd edition, 2013) is shown an EEG signal of a normal person who keeps his eyes closed together with the power spectrum. The frequencies which are most dominant in the signal are around 10 Hz, that is, are in the so-called alpha frequency range (8 to 14 Hz).
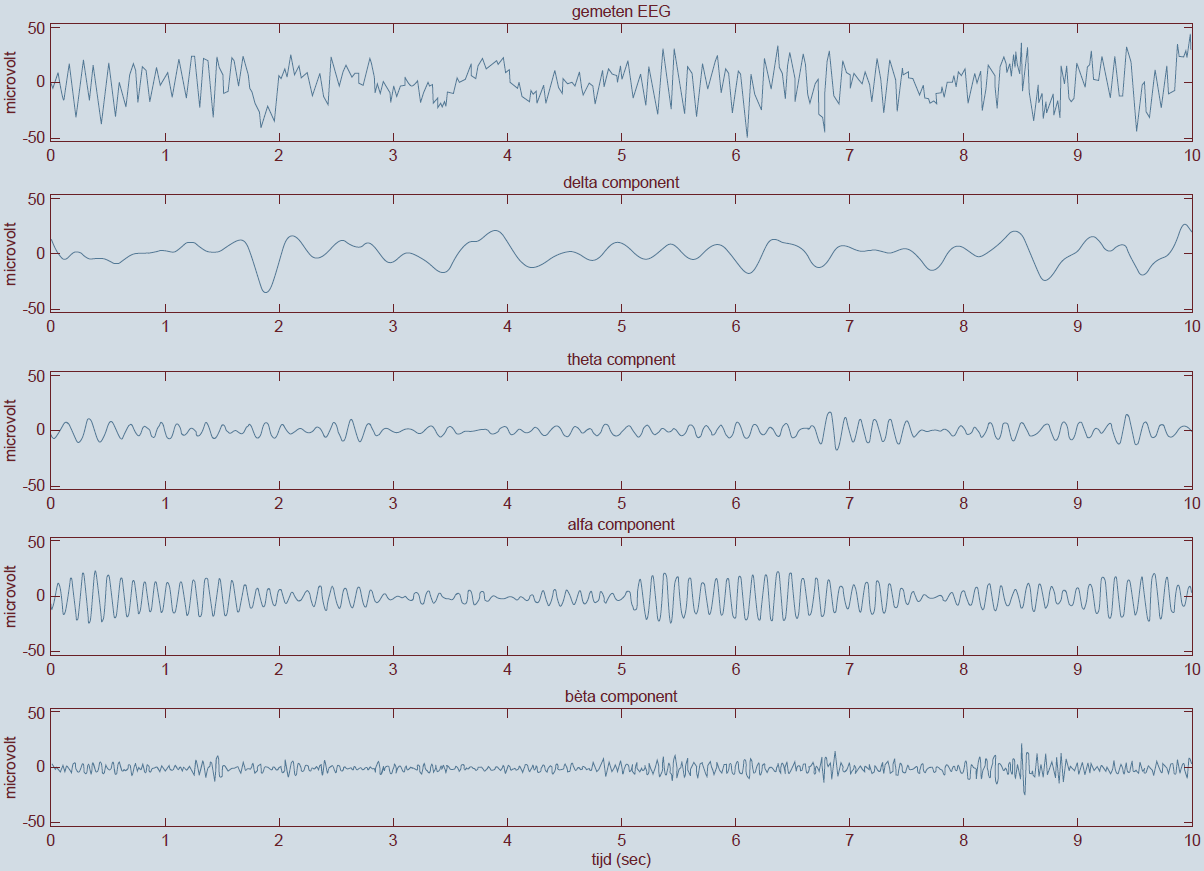
In EEC spectral analysis, a signal is split into contributions from different frequency ranges. The figure below is an episode of a 10 seconds long EEG signal in the top graph. This signal is with computer analysis decomposed into sub-signals, where only slow frequencies (delta; 0 to 4 Hz, 2nd graph from the top), less slow (theta, 4 to 8 Hz), fast (alpha, 8 to 12 Hz), faster (SMR 12 to 14 Hz and beta, 14 to 38 Hz) and fastest fluctuations (range, 38 to 80 Hz) occur. The sum of the four lower graphs is exactly the original signal from the top graph. The appearance of these four graphs can provide information about the state of the brains are, for example, whether one sleeps, is aroused or actually is relaxed. When one makes in clinical practice the statement "we see theta activity", one actually means "we see a dominant theta component." In a real EEG signal are always alpha, beta, and delta components present! Gamma waves have to do with a strong mental activity such as perception, problem solving, fear and consciousness.
