Trigonometry: Trigonometric functions
 Transformations of trigonometric functions
We have already seen that the standard sine and cosine function can be transformed into other periodic functions. We discuss this more systematically.
Vertical translation
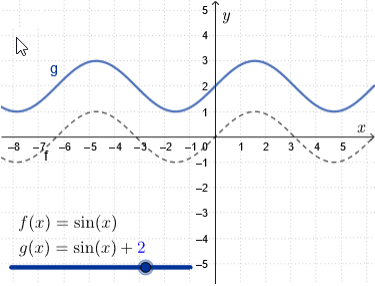
We translate the graph of \(f(x)=\sin(x)\) vertically over a distance \(\blue{d}\).
The new function becomes \[g(x)= \sin(x)+\blue{d}\] The amplitude and the period remain the same, but now you get an equilibrium value equal to \(\blue{d}\).
Horizontal translation
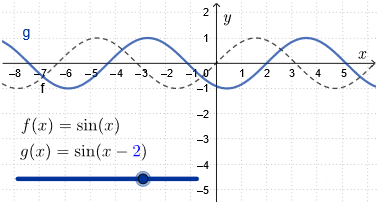
We translate the graph of \(f(x)=\sin(x)\) horizontally to the right over a distance \(\blue{c}\).
The new function becomes \[g(x)= \sin(x-\blue{c})\] The amplitude, the period, and the equilibrium value remain the same, but now you get a translated sine graph. On the interval \((\blue{c},\blue{c}+2\pi)\) the graph goes to the right just like the graph of the sine function on the interval \((0,2\pi)\).
Horizontal scaling
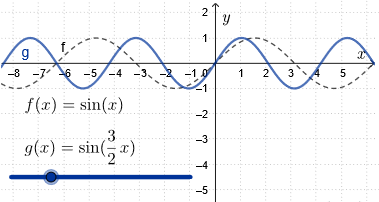
We multiply the graph of \(f(x)=\sin(x)\) with respect to the \(y\)-axis by \(\frac{1}{\blue{b}}\) for certain \(\blue{b}\neq 0\).
The new function becomes \[g(x)= \sin(\blue{b}\,x)\] The amplitude and the equilibrium value remain the same, but the period is now equal to \(\frac{2\pi}{|\blue{b}|}\).
Vertical scaling
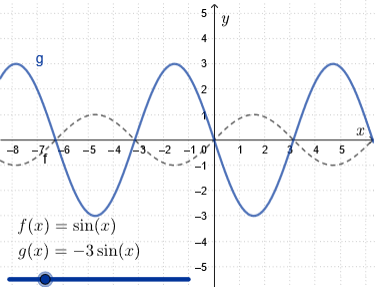
We multiply the graph of \(f(x)=\sin(x)\) with respect to the \(x\)-axis by \(\blue{a}\) The new function becomes \[g(x)= \blue{a}\sin(x)\] The period and the equilibrium value remain the same, but the amplitude is now equal to \(|\blue{a}|\).
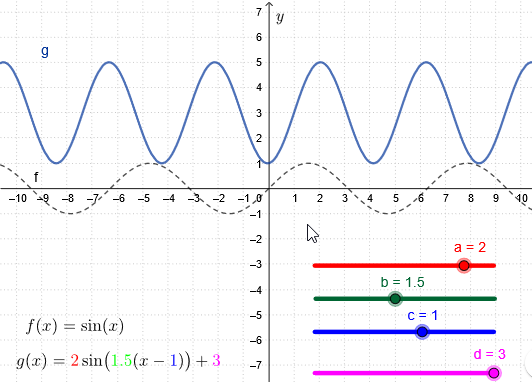
Interactive example You can combine the above transformations to construct any sinusoid., i.e. a function defined as below. In the interactive example below you can explore via the sliders the effect of the parameters \(a\), \(b\), \(c\), and \(d\) that lead to the graph of the function \[g(x)=\color{red}{a}\cdot\sin\bigl(\color{green}{b}\cdot(x-\color{blue}{c})\bigr)+\color{magenta}{d}\].
Identification of the parameters of a sinusoid based on a graph When the graph of a sinusoid \(f\) as a function of time \(t\) is given, the parameters in the formula \[f(t)=a\sin\bigl(b(t-c)\bigr)+d\] can be determined as follows:
- The amplitude \(a\), i.e., the maximum deviation from the equilibrium value, is half the vertical distance between a maximum and minimum;
- The period \(T\) is the horizontal distance between two successive maxima, two successive minima, or two successive horizontal positions in which the graph of the function passes the equilibrium position in an increasing way. Then we have \(b=\frac{2\pi}{T}\);
- The phase \(c\) is the horizontal position of the first positive point where the graph of the function passes the equilibrium position \(d\) and is increasing (all this modulo \(2\pi\));
- The equilibrium value \(d\) is the average of the maximum and minimum value of the function.
Determine exact parameters for the function corresponding to the figure below (it suffices to give one possible value for the phase \(\varphi\) ).
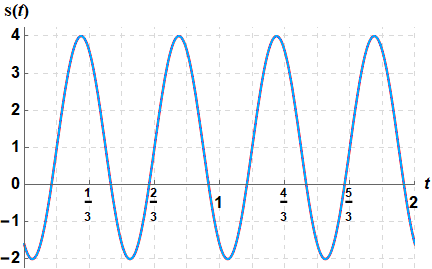
From the graph we read off that the maximum and minimum value are equal to \(4\) and \(-2\), respectively. The amplitude, being the maximal deviation from the equilibrium value, is equal to half the vertical distance between a maximum and minimum, so in this case \(A=\frac{4-(-2)}{2}=\frac{6}{2}=3\).
The equilibrium value\(E\) is the average of the maximum and minimum value of the function and in this case equal to \(\frac{4+(-2)}{2}=\frac{2}{2}=1\).
The period \(T\) is the horizontal distance between two successive horizontal positions where the graph of the function passes the equilibrium value \(E\) and is increasing. In this case we observe that this happens at \(t=\frac{1}{6}\) and \(t=\frac{2}{3}\). So: \(T= \frac{2}{3}-\frac{1}{6}=\frac{1}{2}\). Then we obtain \(\omega=\frac{2\pi}{T}=\frac{2\pi}{\frac{1}{2}}=4\pi\).
To determine the phase angle, we first rewrite the sinusoid in the form \(A\sin\bigl(\omega\,(t-c)\bigr)+E\) because we can easily read off the parameter \(c\) from the graph: it is the horizontal position of the first positive point where the graph of the function passes the equilibrium \(E\) and is increasing. In this case, \(c=\tfrac{1}{6}\). It follows that \(\varphi=-\omega\cdot c=-4\pi\times \tfrac{1}{6}=-\tfrac{2}{3}\pi\).
In summary: \[\begin{aligned}f(t)&=1+3\sin\bigl(4\pi\,(t-\tfrac{1}{6})\bigr)\\[0.25cm] &=1+3\sin(4\pi\,t-\tfrac{2}{3}\pi)\end{aligned}\] Keep in mind that the phase angle is not unique but can be chosen modulo \(2\pi\). For example, if you had chosen \(c=\tfrac{2}{3}\) as a horizontal position of a positive point where the graph of the function passes the equilibrium state \(E\) and is increasing, the result for the phase would have been \(\varphi=-2\pi\times \tfrac{2}{3}=-\tfrac{8}{3}\pi=-\tfrac{2}{3}\pi-2\pi\).

