Unlimited growth: Exponential growth
 Geometrical "solution" via a slope field
Dynamical system The differential equation of exponential growth is an example of a dynamical system, i.e., a differential equation with time as the independent variable. A dynamical system that can be written as a first-order differential equation in the form \[\frac{\dd y}{\dd t}=\varphi(t,y)\] where \(\varphi\) is some function in two variables, can be "solved" in a geometrical manner. Namely, we will discuss that without complicated calculations you often can get an idea about the shape of the graph of a solution of a differential equation. This is based on the fact that the graph of a "decent" function, which goes smoothly in all or nearly all points, looks more like a straight line as you zoom in on a point. That line is the tangent line at that point of the graph of the function.
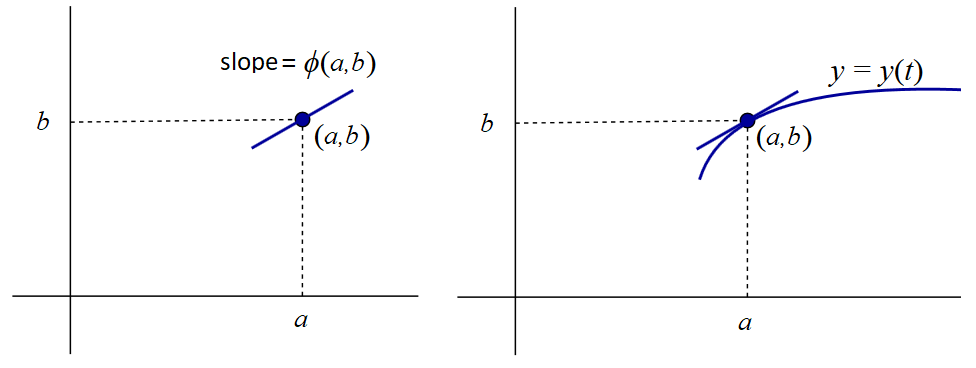
Slope field Consider a point \((a,b)\) and suppose that a solution \(y(t)\) of the differential equation goes through \((a,b)\). For this function \(y\) we have\[y(a)=b\] and \[y'(a)=\frac{\dd y}{\dd t}(a)=\varphi\bigl(a,y(a)\bigr)=\varphi(a,b)\] The tangent line to the graph of \(y\) at point \(a,b\) is determined completely by these two numbers (see left part of the figue below). The equation of the tangent line is in fact \[y=b+\varphi(a,b)\cdot(t-a).\] The function \(y\) itself is unknown, but the tangent line to the graph of \(y\) at \((a,b)\) is known. When you draw at the point \((a,b)\) a small piece of that tangent line, then it will be quite similar to the graph of \(y\) near that point (see the right part of the figure below). Such a line line is called a lineal element at a point of \(t,y\) plane.

You can draw lineal elements at a lot of different points \((a,b)\) in \((t,y)\)-plane. A drawing with a set of lineal elements is called slope field, gradient field or direction field of the differential equation. Usually the points are chosen from a regular grid, but this is not necessary. When you draw a smooth curve that is tangent at any point to the line element there, then you get a so-called integral curve, i.e., the graph of a solution of the differential equation. Such a curve is also called a solution curve. Without much further computing you can often already get in this way an idea of the shape of the graph of the solutions of the differential equation and see how solutions behave as times passes. We will also use the slope field to see how solutions behave in dynamical systems of limited growth.
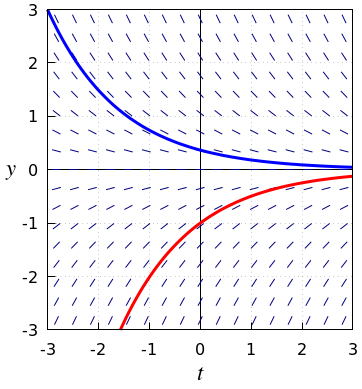
Slope field and solution curves for exponential decay Below is shown the slope field if the differential equation \[\frac{\dd y}{\dd t}=r\cdot y\] where \(r=-0.7\) (i.e., \(\varphi(t,y)=-0.7y\text{).}\) Also included are two integral curves in the figure. It can be seen that all points on a horizontal line have the lineal elements with the same lope: this is because the right-hand side of the differential equation does not depend on time. If you sketch a solution curve by going with the flow, i.e., by following the directions of line segments field, you see that each solution over time approaches the equilibrium solution \(y=0\).

Interactive slope field creator You can play with the interactive version below for computing the slope field of a first-order differential equation. The default example is the differential equation of logistic growth with a sigmoid as example of one of many possible solution curves. By dragging point \(P\) you obtain different solution curves. This interactive diagram also contains a special cursor that draws the line element at any given position.


