Unlimited growth: Applications of exponential growth models
 Blood drug concentration after a single intravenous bolus injection
In this theory page we discuss a basic example in quantitative pharmacokinetics: an open, one-compartmental model for the plasma concentration of a drug after a single, fast, intravenous administration, that is, after a single so-called IV bolus administration. This is done on the basis of data from a clinical trial (Fagan et al., 1982) that explores the pharmacokinetics of propranolol, a beta-blocker that is used, among other things, to lower blood pressure.
By the way, Sir James Black was the scientist who invented propranolol and he received the 1988 Nobel Prize in medicine for this work and in particular for his discoveries of important principles of pharmacology (those interested, please look at this work of Stapleton in 1997 (1997) or interviews at www.webofstories.com/people/james.black).
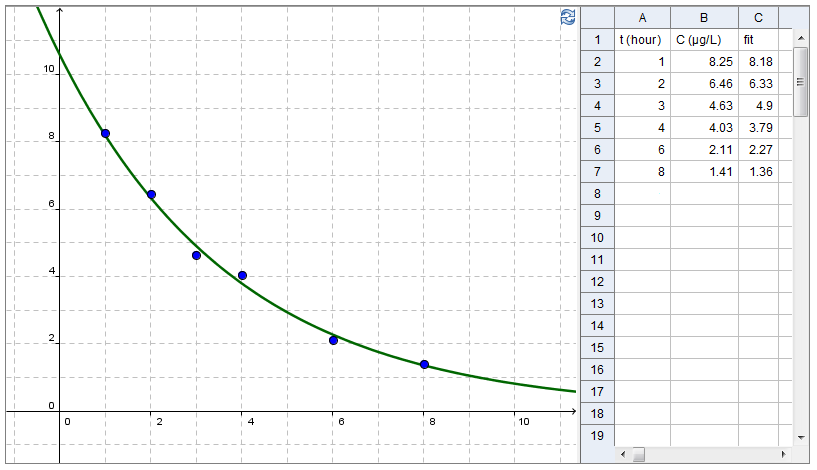
Kinetics of an IV bolus injection of propranolol The following screen shot of a computer program shows the table and the graph of the measured plasma concentration of a test subject in this study. The time \(t=0\) is chosen to be the time that the administration of propranolol is stopped and measured values are determined after a few hours. This figure also shows a successful approximation of the time profile of the drug concentration with a mathematical function. How to get such mathematical approximations will become clear in this section.

Through a number of simplifications one can derive a mathematical model for the time profile of the plasma concentration.
Let \(C(t)\) be the concentration of a drug at time \(t\) after the drug has been injected rapidly into a blood vein and has rapidly distributed throughout the body, so fast that one can assume that at time \(t=0\) the maximum plasma concentration of the drug is present in the body. In pharmacology one also speaks of a single IV bolus injection.
Kinetics according to an open one-compartment model The use of a 1-compartment model also implies that it is assumed that the distribution of the drug across blood plasma and other parts of the body takes place rapidly, so that there is always a state of equilibrium, even if the drug is continuously eliminated from the body. The drug distributes itself over an apparent volume of the compartment in this model, the so-called volume of distribution \(V_d\). This volume of distribution has no true physiologic meaning in terms of an anatomic space, but is only introduced to relate the amount of drug to its measurable concentration. If \(D(t)\) represents the dose still present in the body at time \(t\), then we know \[D(t)=V_d\cdot C(t)\] Now assume that the rate of elimination of the drug is proportional to the plasma concentration: \[D'(t)=-\mathrm{Cl}\cdot C(t),\] where \(\mathrm{Cl}\) is the total body clearance of the drug. Therefore, the unit of clearance is volume per unit of time (L/h, mL/min, etc.), but clearance in tables (see, for example, the dutch websites www.cbg-meb.nl and www.geneesmiddelenrepertorium.nl) is often specified as the number of liters of per unit per 70 kg body weight. Because of the relationship between dose and plasma concentration, we can also write everything in terms of the concentration \(C(t)\); this leads to the following differential equation: \[C'(t)=-k\cdot C(t)\tiny.\] This is an example of first-order kinetics with elimination rate constant \(\mathbf{k}\). The elimination rate constant is equal to \[k=\frac{\mathrm{Cl}}{V_d}\tiny.\] Schematically, this one-compartment model is often represented as follows:

Each compartment is represented by a rectangle: in this case, there is only one compartment, the central compartment, but many models use a multitude of compartments (for example, in order to distinguish the central compartment and the peripheral tissue). The arrows show how substances are absorbed and eliminated by a compartment. The mathematical modelling of these processes is indicated by the arrows: \(D_\mathrm{IV}\) represents a single intravenous bolus injection of dose \(D\) and the letter at the outgoing arrow in the above diagram represents an elimination rate constant according to first-order kinetics. Sometimes, it is explicitly stated when a distribution volume \(V_d\) of the drug plays a role.
Formulas for first-order pharmacokinetics The solution of the differential equation \[C'(t)=-k\cdot C(t)\] equals \[C(t)=C_0\cdot e^{-kt}\] In the example of propranolol, the parameters \(c_0\) and \(k\) are based on data estimated using a fit (mathematicians prefer to speak of the method of regression).
Rather than the elimination rate constant \(k\), the half-life \(t_{1/2}\) of a drug is often given: this is the time needed to halve the concentration. The following relationship applies: \[t_{1/2}=\frac{\ln(2)}{k}\approx \frac{0.693}{k}\] The literature value for the half-life of propranolol is 2.8 hours (Evans et al., 1973)
Literature
Evans, G.H, Nies, A.S., & Shand, D.G. (1973). The disposition of propranolol. III. Decreased half-time and volume of distribution as a result of plasma binding in man, monkey, dog and rat. The Journal of Pharmacology and Experimental Therapeutics, 186(1), 114-122.
Fagan, T.C, Walle, T., Walle, U.K., Conradi, E.C, Harmon, G., & Gaffney, T.E. (1982). Early Kinetics of Intravenous Propranolol. British Journal of Clinical Pharmacology 13, 571-574.
Stapleton, M.P. (1997). Sir James Black and Propranolol. The role of the Basic Sciences in the History of Cardiovascular Pharmacology. Texas Heart Institute Journal, 24(4), 336-342. Online: www.ncbi.nlm.nih.gov/pmc/articles/PMC325477/pdf/thij00027-0106.pdf


