Functions and graphs: Data and graphs
 Graph of a function
Most of the features you willl encounter are "smooth" functions, i.e., functions that have smooth curves as their graphs. To graph such a function, say \(f\), it suffices to calculate a sufficient number of function values \(f(x)\) for several arguments \(x\) and then plot the calculated points \(\bigl(x,f(x)\bigr)\) as points on the graph in the plane. After that, you only have to connect consecutive points with ascending arguments of the function \(f\) via straight line segments or even via curved line segments to avoid graphs with sharp bendings.
To get a good picture of the behaviour of a function in graphical form, you must pay attention to special points. These are for example:
- points at or close to the edge of the function's domain;
- points in the vicinity where the function assumes a maximum or minimum;
- axis intersections, i.e., points where the graph intersects the horizontal or vertical axis of the coordinate system;
- points where the function is not defined or the function rule changes.
When the function rule has a known form, for example a linear function, then you can rely on knowledge that you have already acquired about such a function. But in general, before drawing a graph of a function, you will often first have to do a functional analysis. A large part of Calculus is about doing good functional analysis.
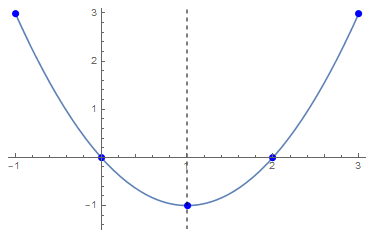
Example of a quadratic function We consider the quadratic function \(f(x)=(x-1)^2-1\) and want to plot the graph on the interval \([-1,3]\).
The points on the boundaries of this interval are easy to calculate: they are the points \((-1,3)\) and \((3,3)\) because \(f(-1)=f(3)=3\).
A square of a real number is always a nonnegative number and equals zero for the number \(0\). Therefore, the point \((1,-1)\) is a point on the graph that lies lowest in the plane. There the function takes a minimum value.
Intersections with the horizontal axis can be found by solving the equation \(f(x)=0\), in this case by determining \(x\) for which \((x-1)^2-1=0\). Then \((x-1)^2=1\) or \(x-1=\pm 1\) must hold. So: \(x=0\) or \(x=2\). The graph of \(f\) intersects the horizontal axis at the points \((0,0)\) and \((2,0)\). In this example, the axis cut with the vertical axis is also known immediately.
An important property of the function is that \(f(1+x)=f(1-x)\) for any number is \(x\). Just check it: \(f(1+x)=x^2-1=(-x)^2-1=f(1-x)\). This means that the graph of \(f\) is symmetric with respect to the vertical line \(x=1\), i.e., the graph remains the same if you mirror it in the vertical line \(x=1\). In other words, if you know what the graph looks like on the interval \([1,3]\), then you can also draw the graph on the interval \([-1,1]\) by mirroring.
With this, quite a lot has already become known about the graph in order to draw it. Below is the computer generated diagram. We show the distingusied points and the dashed symmetry axis.

Formal definition of the graph of a function The graph of a function \(f\) is the set of ordered pairs \((x,y)\) for which \(y=f(x)\). If \(x\) and \(y\) are real numbers, you can think of the pair as coordinates of points in \(\mathbb{R}^2\). A more formal definition of the graph of a function is as follows:
Let \(D\) a subset of \(\mathbb R\). The graph of a function \(f\,\text{:}\,D\to\mathbb{R}\) is the set \[\left\{\bigl(x,f(x)\bigr)\in D\times\mathbb{R}\mid x\in D\right\}\text{.}\] This graph is made visible by drawing this set of points in \(\mathbb{R}^2\) in the real plane.
If we define a graph as a subset of \({\mathbb R}^2\), then it is clear that every graph of a function is indeed a graph. But the reverse is not true. The circle with the origin as centre and radius \(1\) can be described as \(\{(x,y)\in\mathbb{R}^2\mid x^2+y^2=1\}\), but this is not the graph of a function \(f\). For each \(x\) from the interval \((-1,1)\) should be two function values, namely \(\pm\sqrt{1-x^2}\), but that is not allowed in a function. A function must return at most one value for a given argument.
Recognising the graph of a function The graph of a function has the following property:
If \((x,y)\) and \((x,z)\) elements from the graph of a function, then \(y=z\).
Conversely, if a graph has this property, then it is also the graph of a function.


