Numerical differentiation: Time series
 Processing of an EMG signal via convolution (programming assignment)
In this assignment we will process and analyse an EMG measurement in two ways. EMG is an abbreviation for electromyography and it concerns voltage measurement on the surface of the skin as a result of muscle activity. We use the EMG data stored in the enclosed comma-separated Excel file EMG.csv
Before the real analysis can begin, we perform the following data processing steps in the computer program:
- Import the EMG signal from the comma-separated CSV file EMG.csv
- Limit yourself (for convenience) to the measurement between 0.3 and 1.0 second.
- Subtract the average of the measurement data on this interval from the data.
This is the dataset wewill be working with.
The first analysis method we implement is called full-wave rectification and consists of two steps:
- Take the absolute value for each data point.
- Then apply the moving average filter with a certain filter width.
You have at this stage obtained the rectified measurement signal, which is called average rectified value (ARV) amplitude in the specialist literature.
Now consider how to define the moving average in terms of time series convolution and use this to implement a custom vgem function in the programming language that you seelcted to use.
Apply your moving average function to determine the ARV amplitude at a filter width of 25.
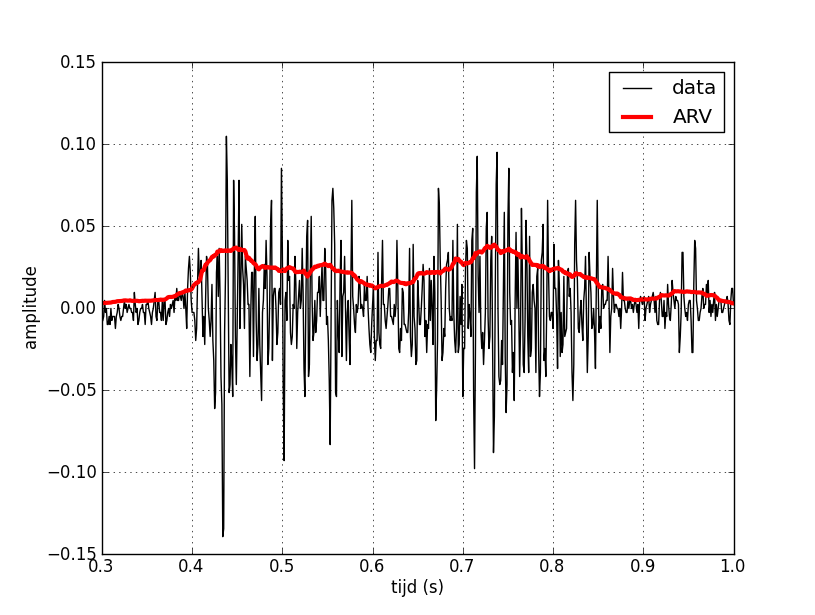
Plot the rectified signal together with the data set in one diagram.
This can look like this:

The second analysis method to implement is known as root-mean square (RMS). This filter with filter \(m\) is defined by the formula \[\mathrm{RMS}(x)_n=\sqrt{\frac{1}{2m+1}\sum_{j=-m}^{m}x_{n+j}^2}\] In other words, you average the squares of a certain number of consecutive values and take the square root of that intermediate result. The signal after application of this filter is called the RMS amplitude. Unlike ARV amplitude, the RMS amplitude of an EMG signal has physical and physiological significance and is therefore of great value in EMG analysis.
Now think about how you can define the root-mean-square filter in terms of convolution of time series and use it to implement your own RMS function in the selected programming language.
Apply your root-mean square filtering function to determine the RMS amplitude at a filter width of 25.
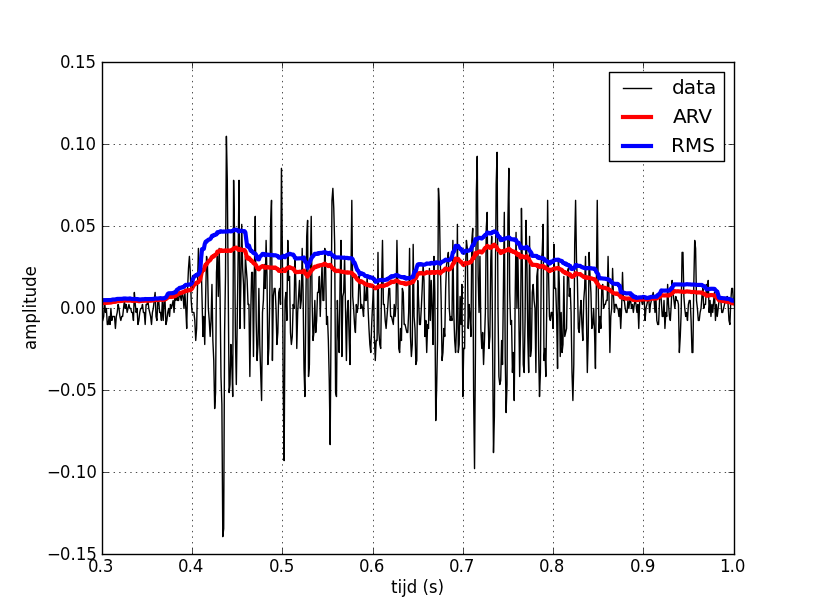
Plot this signal together with the dataset and the ARV amplitude in one diagram.
It may look as follows:


