Doing mathematics with R: Differential equations in R
 Stability analysis of an autonomous first-order differential equation
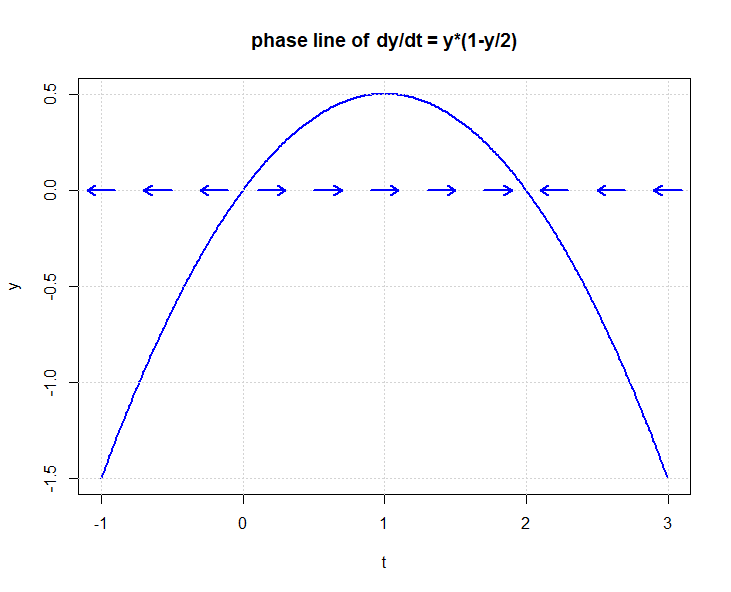
The phaseR package includes the functions stability and phasePortrait to determine the stability of an equilibrium in an autonomous first-order differential equation and to construct a phase portrait. But what is called phase portrait in this package, is also referred to as phase line in the literature. We illustrate the use of the phaseR package with the differential equation \[\frac{\dd y}{\dd t}=y\cdot (1-y/2)\] This differential equation has an attracting equilibrium \(y=2\) and a repelling equilibrium \(y=0\). This is confirmed through the R script below. The phase line is also drawn. We refer to the phaseR manual for more details about the different options in the stability and phasePortrait instructions.
library(phaseR)

model <- function(time, initialstate, parameters){
  with(as.list(c(initialstate, parameters)), {
    dydt <-  r*y*(1-y/K)
    return(list(dydt))
  })
}

params <- c(r = 1, K = 2)

cat("\nStability y = 0:\n")
stability(model, ystar = 0, parameters = params,
          system = "one.dim", state.names = c("y"))
cat("\n\nStability y = 2:\n")
stability(model, ystar = 2, parameters = params,
          system = "one.dim", state.names = c("y"))

phasePortrait(model, ylim = c(-1,3), ystep = 0.01,
              parameters = params, state.names = c("y"),
              points = 11, frac = 0.5, arrow.head = 0.1,
              col = "blue", lwd = "2", xlab = "t", ylab = "y",
              main = "phase line of dy/dt = y*(1-y/2)",
              add.grid = TRUE)
In the console windows appears then
Stability y = 0:
Discriminant: 1   Classification: Unstable

Stability y = 2:
Discriminant: -1   Classification: Stable
and the following diagram is plotted:


