Doing mathematics with R: Differential equations in R
 Phase portrait of an autonomous system of two differential equations
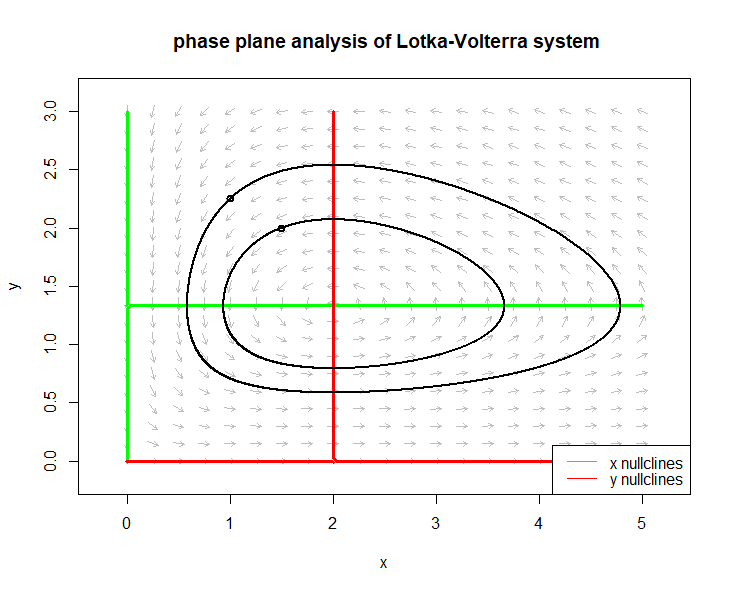
The phaseR package includes the flowField function to plot the phase portrait, also called direction field, of an autonomous system of two differential equations. We illustrate this using the following Lotka-Volterra system \[\left\{\begin{aligned} \frac{\dd x}{\dd t} &= x\cdot (a-b\cdot y) \\[0.25cm] \frac{\dd y}{\dd t} &=y\cdot(c\cdot x-d)\end{aligned} \right.\] with \[a=0.4,\quad b=0.3,\quad c=0.1,\quad d=0.2\] The R script below
library(phaseR)

model <- function(time, initialstate, parameters){
  with(as.list(c(initialstate, parameters)),{
    dxdt <- x * (a - b*y)
    dydt <- y * (c*x - d)
    return(list(c(dxdt, dydt)))
  })
}

params <- c(a = 0.4, b = 0.3, c = 0.1, d = 0.2)

flowField(model, xlim = c(0, 5), ylim = c(0, 3),
          parameters = params, system = "two.dim",
          state.names = c("x", "y"), points = 21,
          add = FALSE, xlab ="x", ylab ="y",
          main = "phase plane analysis of Lotka-Volterra system")

nullclines(model, xlim = c(-0.01, 5), ylim = c(-0.01,3),
           parameters = params, system = "two.dim",
           state.names = c("x", "y"),
           col=c("green","red"), lwd = 3, add = TRUE)

trajectory(model, y0 = c(1.5, 2), tlim = c(0, 25),
           parameters = params, state.names = c("x", "y"),
           lwd = 2)
trajectory(model, y0 = c(1, 2.25), tlim = c(0, 25),
           parameters = params, state.names = c("x", "y"),
           lwd = 2)
plot a directional field for the system including the \(x\) and \(y\) null isoclines and two solution curves forming a closed orbit due to periodic solutions.

Other examples are included in the phaseR package and are described at https://cran.r-project.org/web/packages/phaseR/vignettes/introduction.html For example, you can read that the phasePlaneAnalysis function carries out an analysis in the phase plane without having to use separate functions. In our example you would only need to use the following R script and then choose the desired options:
phasePlaneAnalysis(model, xlim = c(0, 5), ylim = c(0, 3),
          parameters = params, system = "two.dim",
          state.names = c("x", "y"))

