Basic skills in R: Basic graphics
 Bar graph
A bar graph is created in R with the function barplot(). Its use is quite straightforward for simple cases (like showing the values along one discrete or categorical variable), but you can also make more advanced graphs (like stacked or grouped barplots).
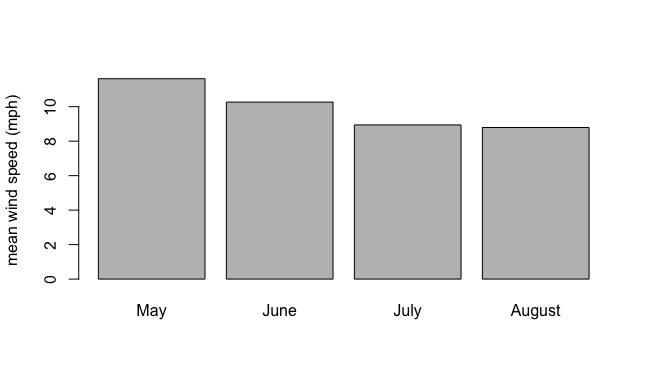
In the first two example below we limit ourselves to a simple case, where we first calculate mean wind speeds per month and then display these (but do note how the labels in the barplot are automatically included along the x-axis because we labelled the entries in the data vector mean_wind). In this example we will use in the built-in dataset airquality (from the "datasets" package).
Air quality example of a barplot
R script
mean_wind <- with(airquality,
   c(May = mean(Wind[Month==5]),
    June = mean(Wind[Month==6]),
    July = mean(Wind[Month==7]),
  August = mean(Wind[Month==8]))
)

barplot(mean_wind, ylab="mean wind speed (mph)")
Bar graph
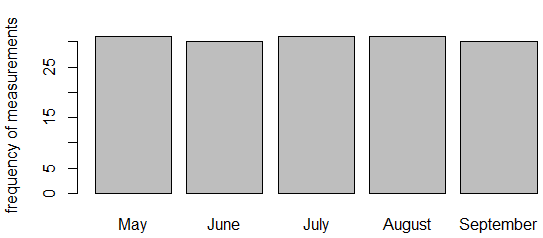
We can also make a bar graph of the frequency with which a categorical variable occurs in a dataset. Then, we first need to calculate the frequencies using the function table(). This output can be directly passed into the function barplot(). In this example we get the impression that every day the wind has been recorded, leading to frequencies of 30 and 31 measuments per month.
Frequency barplot
R script
frequency_per_month <- table(airquality$Month)

barplot(frequency_per_month,
  names.arg = c("May", "June", "July",
                "August", "September"),
  ylab = "frequency of measurements")
Bar graph
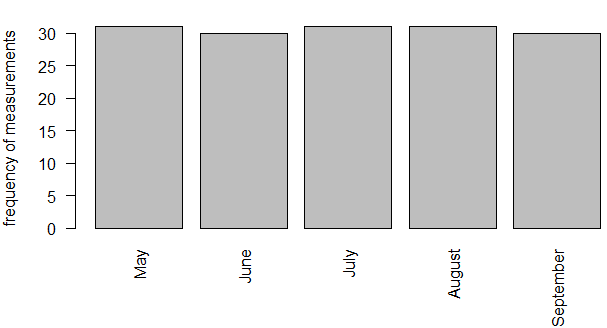
Rotated labels In case the bar graphs contains many bars, it may be more useful to rotate the labels of these bars. This can be done via the las argument.
R script continuation
barplot(frequency_per_month,
  names.arg = c("May", "June", "July",
                "August", "September"),
  ylab = "frequency of measurements",
  las = 2  # rotate labels
)
Bar graph with rotated labels
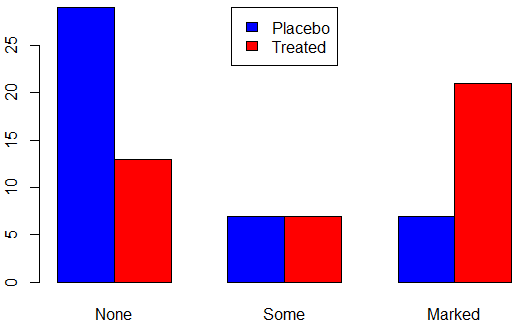
Grouped bar graph In this example we use again the Arthritis dataset included with the vcd package. We create a grouped bar graph in wich the height of the bars indice the frequency of all combinatin of two categorical variables (Improved and Treatment)
> install.packages("vcd")
> library(vcd)
> str(Arthritis)
'data.frame':	84 obs. of  5 variables:
 $ ID       : int  57 46 77 17 36 23 75 39 33 55 ...
 $ Treatment: Factor w/ 2 levels "Placebo","Treated": 2 2 2 2 2 2 2 2 2 2 ...
 $ Sex      : Factor w/ 2 levels "Female","Male": 2 2 2 2 2 2 2 2 2 2 ...
 $ Age      : int  27 29 30 32 46 58 59 59 63 63 ...
 $ Improved : Ord.factor w/ 3 levels "None"<"Some"<..: 2 1 1 3 3 3 1 3 1 1 ...
> two_way_table
         Improved
Treatment None Some Marked
  Placebo   29    7      7
  Treated   13    7     21
> barplot(two_way_table, beside=TRUE, col = c("blue", "red"))
> legend("top", legend = c("Placebo", "Treated"), fill = c("blue", "red"))