Basic skills in R: Basic graphics
 Histogram
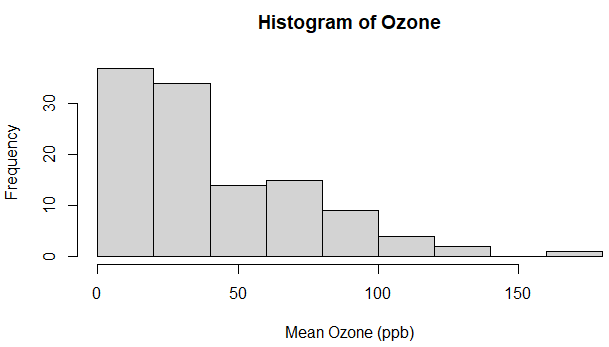
Below is an example of a simple histogram made using the function hist(). Again we use the airquality dataset.
Ozone example of a histogram
R script
> with(airquality,
+      hist(Ozone, xlab="Mean Ozone (ppb)"))
This example gives a simple histogram showing the frequency with which certain Ozone values occur in the dataset.
Histogram

The next example is about drawing a histogram of a set ef randomly generated numbers for a Poisson distribution with density function \[p(k)=\frac{\lambda^{k}e^{-\lambda}}{k!}\] for \(k=0,1,2,3\ldots\) and some fixed parameter value \(\lambda\).
Histogram of random data for a Poisson distribution
> set.seed(123)
> rpois(n = 10,lambda = 5.5)  # a sequence of random numbers
 [1] 4 7 5 8 9 2 5 8 6 5
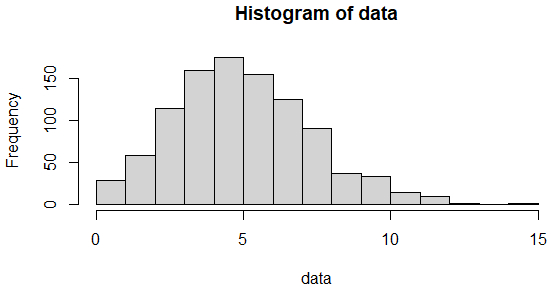
> data <- rpois(n = 1000, lambda = 5.5)
> hist(data, breaks = 11) # suggestion of 11 breaks, but in reality 16 used

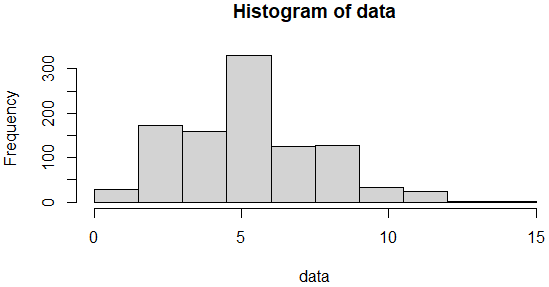
> forced_breaks <- seq(min(data), max(data), length.out = 11) # 11 breaks
> forced_breaks
 [1]  0.0  1.5  3.0  4.5  6.0  7.5  9.0 10.5 12.0 13.5 15.0
> hist(data, breaks = forced_breaks)

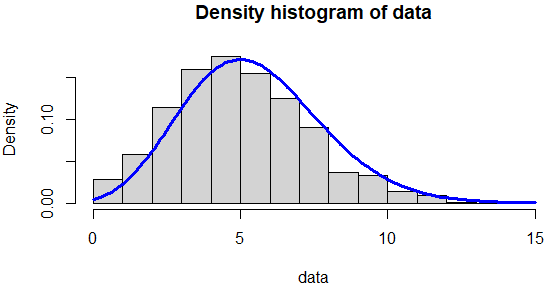
> # density histogram + graph of the density function of the Poisson distribution
> hist(data, breaks = 16, freq = FALSE, main = "Density histogram of data")
> curve(5.5^x*exp(-5.5)/factorial(x), from = 0, to = 15, col = "blue", lwd = 3, add = TRUE)

Unlock full access


