Basic skills in R: Basic graphics
 Line graph
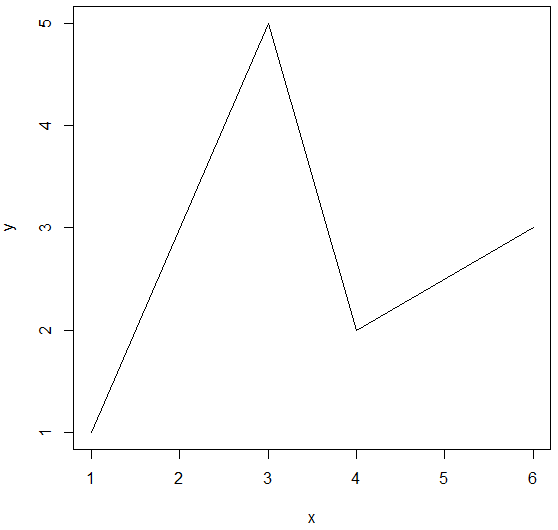
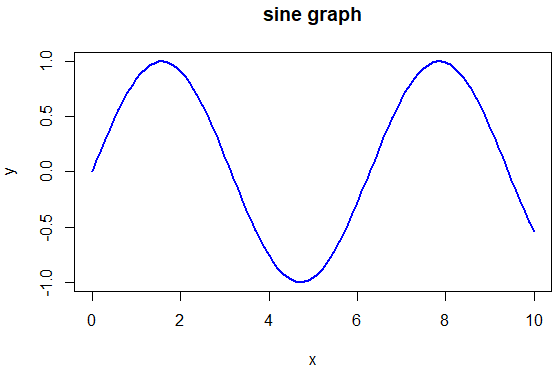
A line graph is nothing else than a connected scatter plot without the points, i.e. a scatter plot with points connected by straight line segments in hwich the points have been omitted. All you have to do is to specify type = "l" in the function plot(). In this way graphs smooth functions can also be constructed.
A simple line graph
R session
> x <- c(1, 3, 4,6)
> y <- c(1, 5, 2, 3)
> plot(x, y, type="l")
Line graph

Graph of a function
R session
> x <- seq(from = 0, to = 10, by = 0.1)
> y <- sin(x)
> plot(x, y, type = "l", main = "sine graph",
+      col = "blue", lwd = 2)
Line graph

Unlock full access


