1. Descriptive Statistics: Frequency Distributions
 Measures of Location I: Quantiles
Besides describing the characteristics of a distribution as a whole, descriptive statistics can also be used to provide more information about individual scores. One particularly useful piece of information is the location of a score relative to all other scores within the distribution.
Knowing a score's location relative to the other scores can, for instance, help you judge whether a particular score should be considered high, low, or average. Raw scores are, by themselves, not very informative in this regard.
One way to express a score's location within a distribution is to calculate its percentile rank.
#\phantom{0}#
Percentile Rank
The percentile rank of a score is the percentage of scores in the distribution that are equal to or lower than it.
A student scored #70# points at an exam and would like to know how well she did compared to her classmates. The scores of the entire class are as follows:
\[34\,\,\,\,42\,\,\,\,53\,\,\,\,56\,\,\,\,57\,\,\,\,60\,\,\,\,62\,\,\,\,64\,\,\,\,64\,\,\,\,67\,\,\,\,70\,\,\,\,70\,\,\,\,72\,\,\,\,78\,\,\,\,84\,\,\,\,89\]
To calculate the percentile rank of #X=70#, first count the number of scores that are equal to or lower than #70#, which in this case is #12#.
Next, divide that number by the total number of scores, which in this case is #16#, and multiply by #100\%#.
\[\cfrac{12}{16}\cdot 100\% = 75\%\]
So the percentile rank of #X=70# is #75#.
#\phantom{0}#
When a score is identified by its percentile rank, the score is called a percentile.
#\phantom{0}#
Percentiles
Definition
Percentiles are the values that divide a distribution of scores into one hundred equal parts.
The #P^{th}# percentile of distribution is the value such that #P# percent of the scores are equal to or below it.
Formula
The index of the #P^{th}# percentile of a distribution is:
\[i = \dfrac{P}{100}(n-1)+1\]
where #n# is the number of scores and #P# is a value between 1 and 99.
Percentile Calculation
The calculation of the #P^{th}# percentile starts by ordering the scores in the distribution from smallest to largest. Next, to find the index #i# of the #P^{th}# percentile, use the following formula:
\[i = \dfrac{P}{100}(n-1)+1\]
where #n# the total number of scores in the distribution.
It is important to note that formula above is used to determine the location of the #P^{th}# percentile and not the value associated with it.
If #i# is an integer, then the #P^{th}# percentile is the score located at the #i^{th}# position of the ordered data.
Whenever #i# is not an integer, linear interpolation is used to calculate the percentile:
- Find the two integers closest to #i# by rounding #i# up and down. These indices are denoted by #i_{above}# and #i_{below}#, respectively.
- Determine the values located at these positions. These values are denoted by #X_{above}# and #X_{below}#, respectively.
- Calculate the #P^{th}# percentile with the following formula:\[P^{th}\text{ percentile}=X_{below} + (i - i_{below}) \cdot (X_{above} - X_{below})\]
There are a number of different ways we can calculate the #20^{th}# percentile. Click on one of the panels to toggle a specific solution.
\[1,\,\,\,2,\,\,\,5,\,\,\,5,\,\,\,6,\,\,\,6,\,\,\,7,\,\,\,9,\,\,\,10,\,\,\,10,\,\,\,12,\,\,\,12,\,\,\,14,\,\,\,14,\,\,\,14,\,\,\,15,\,\,\,17,\,\,\,17,\,\,\,18,\,\,\,20,\,\,\,21\]
Next, to find the index #i# of the #20^{th}# percentile (#P=20#), use the following formula:
\[\begin{array}{rcl}
i &=& \cfrac{P}{100}(n-1)+1\\
&=& \cfrac{20}{100}(21 - 1) + 1=5
\end{array}\]
Since #i=5# is an integer, the #20^{th}# percentile is the score located at the #5^{th}# position of the ordered data:
\[P_{20}= X_{5} = 6\]
Assuming the sample scores are located in cells A1 through A21, the Excel command to calculate the #20^{th}# percentile is:PERCENTILE(array, k)
- array: The array or cell range of numeric values for which you want the percentile value.
- k: The percentile value in the range #[0, 1]#, inclusive.
\[= \text{PERCENTILE(A1:A21, 0.2)}\]
This gives:
\[P_{20} = 6\]
Thus, to calculate the #20^{th}# percentile, run the following command:quantile(x, probs)
- x: The numeric vector whose sample quantiles are wanted.
- probs: The numeric vector of probabilities with values in the range #[0, 1]#.
\[quantile(x = c(9,17,15,7,10,14,18,5,14,12,6,2,5,17,21,6,1,20,14,10,12), probs = 0.2)\]
This gives:
\[P_{20}= 6\]
#\phantom{0}#
Percentiles divide a distribution into #100# equal parts. It is possible, however, to divide a distribution into any arbitrary number of equal parts. When dividing a distribution of scores into equal parts, the dividing values are called quantiles.
#\phantom{0}#
Quantiles
If you divide the data set into #k# equal parts, you call the dividing values #k#-quantiles and there are always #k-1# quantiles.
#\phantom{0}#
If you divide a distribution of scores into four equal parts, the dividing values are referred to as quartiles.
#\phantom{0}#
Quartiles
Definition
Quartiles are the values that divide a distribution of scores into four equal parts.
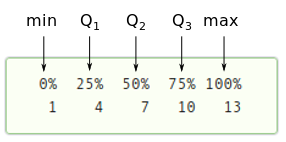
The first (#Q_1#), second (#Q_2#), and third (#Q_3#) quartiles are equal to the 25th, 50th, and 75th percentile, respectively.
The second quartile is also called the median.
Formula
The index of the #Q^{th}# quartile of a distribution is:
\[i=\dfrac{Q}{4}(n-1)+1\]
where #n# is the number of scores and #Q# is a value between 1 and 3.
Quartile Calculation
The calculation of quartiles starts by ordering the scores in the distribution from smallest to largest. Next, to find the index #i# of the #Q^{th}# quartile, use the following formula:
\[i=\dfrac{Q}{4}(n-1)+1\]
where #n# is the total number of scores in the dataset.
It is important to note that formula above is used to determine the location of the #Q^{th}# quartile and not the value associated with it.
If #i# is an integer, then the #Q^{th}# quartile is the score located at the #i^{th}# position of the ordered data.
Whenever #i# is not an integer, linear interpolation is used to calculate the quartile:
- Find the two integers closest to #i# by rounding #i# up and down. These indices are denoted by #i_{above}# and #i_{below}#, respectively.
- Determine the values located at these positions. These values are denoted by #X_{above}# and #X_{below}#, respectively.
- Calculate the #Q^{th}# quartile with the following formula:\[Q^{th}\text{ quartile}=X_{below} + (i - i_{below}) \cdot (X_{above} - X_{below})\]
R Calculation
To calculate a quartile of a dataset in R, make use of the following function:
quantile(x)
- x: The numeric vector whose sample quantiles are wanted.
In the output generated by R, the first, second, and third quartiles can be found under #25\%#, #50\%#, and #75\%#, respectively.
There are a number of different ways we can calculate the #2^{nd}# quartile. Click on one of the panels to toggle a specific solution.
\[1,\,\,\,4,\,\,\,4,\,\,\,5,\,\,\,6,\,\,\,6,\,\,\,8,\,\,\,9,\,\,\,10,\,\,\,10,\,\,\,14,\,\,\,17,\,\,\,17,\,\,\,17,\,\,\,18,\,\,\,19,\,\,\,20,\,\,\,21,\,\,\,21,\,\,\,23,\,\,\,25\]
Next, to find the index #i# of the #2^{nd}# quartile (#Q=2#), use the following formula:
\[\begin{array}{rcl}
i &=& \cfrac{Q}{4}(n-1)+1\\
&=& \cfrac{2}{4}(21 - 1) + 1=11
\end{array}\]
Since #i=11# is an integer, the #2^{nd}# quartile is the score located at the #11^{th}# position of the ordered data:
\[Q_{2}=X_{11} = 14\]
Assuming the sample scores are located in cells A1 through A21, the Excel command to calculate the #2^{nd}# quartile is:QUARTILE(array, quart)
- array: The array or cell range of numeric values for which you want the quartile value.
- quart: Indicates which quartile to return.
\[= \text{QUARTILE(A1:A21, 2)}\]
This gives:
\[Q_{2} = 14\]
Thus, to calculate the #2^{nd}# quartile, run the following command:quantile(x)
- x: The numeric vector whose sample quantiles are wanted.
\[quantile(x = c(4,8,23,25,6,14,9,20,10,17,18,19,6,17,21,17,5,21,1,10,4))\]
Looking at the output generated by R, under #50\%# we find:
\[Q_{2}= 14\]


