1. Descriptive Statistics: Measures of Variability
 Deviation from the Mean and the Sum of Squares
A very important concept in statistics is a score's distance or deviation from its mean.
Deviation score
To calculate a score's deviation score, subtract the mean of the distribution from the raw score.
\[\text{deviation score} = X - \bar{X}\]
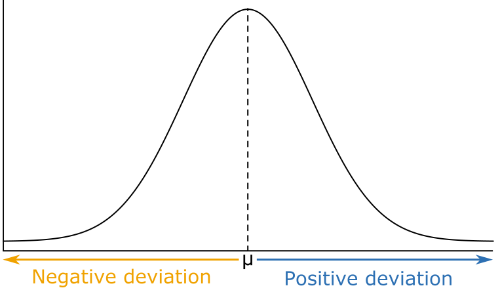
The sign of the deviation score indicates on which side of the mean the score is located:
- Scores with a #\blue{\text{positive}}# deviation score are located #\blue{\text{above}}# the mean.
- Scores with a #\orange{\text{negative}}# deviation score are located #\orange{\text{below}}# the mean.
The value of the deviation score indicates the absolute distance between the score and the mean of the distribution.

Deviation scores serve as the basis for numerous statistical measures, including:
- Sum of Squares
- Z-scores
- Pearson correlation coefficient
Unfortunately, it is not possible to obtain a measure of variability by calculating the average deviation score. This is because positive and negative deviation scores will always cancel each other out perfectly. The result is that the sum of all deviation scores will always be equal to zero, which subsequently ensures that the average deviation from the mean will also be equal to zero.
\[\text{Average deviation score}=\dfrac{\sum(X-\bar{X})}{n} = \dfrac{0}{n} = 0\]
There are a couple of ways to circumvent this problem, one of which is to square all deviation scores before averaging. By squaring, all deviation scores are turned into positive values which prevents positive and negative deviation scores from canceling one another. These squared deviation scores can then be added together and the resulting measure is called the sum of squares.
Sum of Squares
Definition
The sum of the squared deviation scores is referred to as the sum of squares and is abbreviated as #SS#.
Formula
\[SS = \sum{(X-\bar{X})^2}\]
The sum of squares serves as the basis for numerous statistical measures and analyses, including:
- Variance and standard deviation
- Analysis of Variance (ANOVA)
- Regression analysis
Consider the following sample of scores:
\[12\,\,\,\,\,\,8\,\,\,\,\,\,3\,\,\,\,\,\,11\,\,\,\,\,\,4\,\,\,\,\,\,4\,\,\,\,\,\,\]
Calculate the sum of squares for this sample.
#SS=76#
In order to calculate the sum of squares, first determine the mean of the sample:
\[\bar{X} = \cfrac{\sum{X}}{n} = \cfrac{12 + 8 + 3 + 11 + 4 + 4}{6} = \cfrac{42}{6} = 7\]
Now that the mean of the sample is known, each score's deviation score and squared deviation can be calculated:
| #X# | #X-\bar{X}# | #(X-\bar{X})^2# |
| #12# | #\phantom{-}5# | #25# |
| #8# | #\phantom{-}1# | #1# |
| #3# | #-4# | #16# |
| #11# | #\phantom{-}4# | #16# |
| #4# | #-3# | #9# |
| #4# | #-3# | #9# |
Finally, add all the squared deviations together to calculate the sum of squares:
\[SS = \sum{(X - \bar{X})^2} = 25+1+16+16+9+9=76\]
It is also possible to calculate the sum of squares in R. Click on the panel to toggle this solution.
\[x = c(12,8,3,11,4,4)\\
SS = sum((x-mean(x))^2)\]


