3. Probability: Practical 3
 Introduction
Objectives
Learn how to do the following in R
- make basic probability calculations
- apply the probability rules to real data
Instruction
- Read through the text
- Execute code-examples and compare your results with what is explained in the text
- Make the exercises
- Time: 180 minutes
Introduction
One of the most famous maritime disasters occurred during the maiden voyage of the ocean liner Titanic. The Titanic, at that time the largest passenger ship ever built, struck an iceberg in the North Atlantic and sank on April 15, 1912. About 1/3 of the approximately 2200 people on board survived the disaster (705 survivors were recorded).
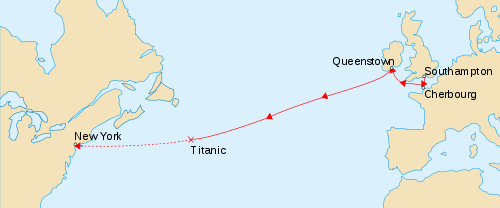
titanic track
Many articles, books, and movies have told the story of this disaster, but a relatively straightforward statistical analysis tells the story in a remarkably evocative way. So this is what we are going to do during this practical. We will conduct probability calculations to answer some of the glaring questions that have been asked since the disaster: how were class, age and gender related to survival?
For this exercise, we will concentrate on passengers only (the crew is left out).


