5. Sampling: Practical 5a
 Introduction
Objectives
Learn how to do the following in R
- take samples from data using the function sample()
- calculate the mean and proportion of a variable obtained through random sampling, stratified sampling and cluster sampling
- evaluate whether random sampling, stratified sampling or cluster sampling would be a preferred approach to estimate a mean or proportion
Instruction
- Read through the text below
- Execute code-examples and compare your results with what is explained in the text
- Make the exercises
- Time: 60 minutes
Introduction
Barro Colorado Island is located in the middle of the Panama Canal, 30 kilometers from Panama City. The island is 15 square kilometer in size and home to one of the oldest tropical research stations in the world where studies have been carried out for more than 100 years. One of these studies involves the long-term monitoring of a 1000 meter by 500 meter rectangular (50 hectares) forest plot. In 1982 every individual tree within this plot was measured, mapped, identified at the species level and permanently numbered with an aluminium tag. This complete inventory (= census) has been repeated six times since (in 1985, 1990, 1995, 2000, 2005, and 2010).
The Barro Colorado Island forest census plot dataset (henceforth we will call it the BCI dataset) is special because it represents an inventory of all individuals of a specific population (trees in this case) in a fairly large area - usually only a sample from a population is taken to measure the status of a natural system. In this practical, we will also exploit this special property of the BCI dataset.
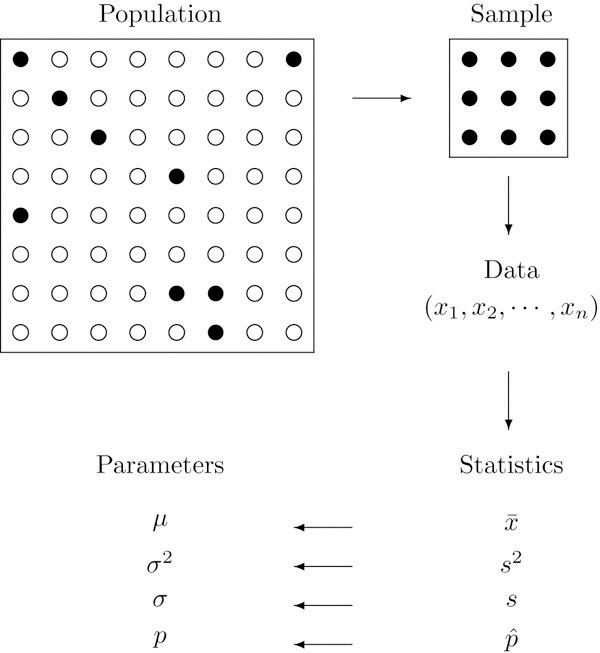
The relation between a population and a sample from that population is crucial in statistics. The figure below illustrates this relation: a sample represents a subset (usually only a tiny subset) from a population. And the values of interest for a given research question are taken from that sample, this leads to a data set (in the figure: #(x_1,x_2,...,x_n)#. Any statistics that are calculated from that data (such as the mean, variance, standard deviation or proportion) do hopefully represent the population parameters well.

Figure 1. Schematic relation between a population, a sample taken from that population, data values based on that sample, (sampling) statistics derived from data and the (hopefully good) match between the sampling statistics and population parameters.
Normally we do not know the values of the (true) population parameters, because the entire population has not been observed. But in this special case of the BCI dataset, we do in fact have observations for the complete population. So we can check how well a given sample can be used to estimate the population parameters well.
And that's exactly what we are going to do in this practical: we will explore how different sampling methods result in different statistics and how well these sample statistics estimate the population parameters.
To make the data manageable for this practicum we selected circa half of the total 50 hectares of forest plot for the 2010 census. We also cleaned the data for you (i.e. we removed trees that were identified in the previous census, but that were not found or dead in the 2010 census). You can load the data through the following command:
source('http://horizon.science.uva.nl/public/VVA/bci_sub_load_rda.R')
Take a look at https://repository.si.edu/handle/10088/20925 if you are interested in the complete dataset.


