7. Hypothesis Testing: Introduction to Hypothesis Testing
 Computing the p-value and Making a Decision
p-value
The #\boldsymbol{p}#-value of a test is the probability, when the null hypothesis #H_0# is assumed to be true, of observing a test statistic equal to or more extreme than what was actually observed.
For a two-tailed test, the #p#-value is a two-tailed probability, which means it is evenly split between both tails.
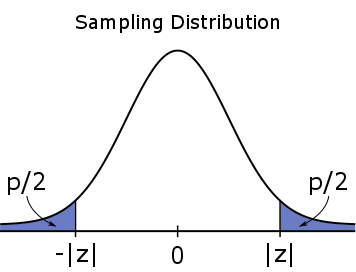
#H_a: \mu \neq \mu_0#
For a one-tailed test, the #p#-value is a one-tailed probability, which means it is entirely located in one of the tails.
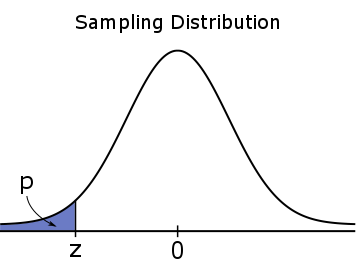
#H_a: \mu \lt \mu_0#
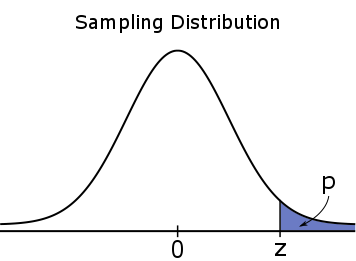
#H_a: \mu \gt \mu_0#
Interpretation of a p-value
The #p#-value is not the probability that the null hypothesis #H_0# is false. The status of #H_0# is non-random.
The sample is random, so consequently, the test statistic is also random. Thus the #p#-value concerns the test statistic.
A small #p#-value implies that the value of the test statistic is not in the range of values that we would expect if #H_0# is true.
Calculating the p-value of a z-test for a Population Mean with Statistical Software
The calculation of the #p#-value of a #z#-test for #\mu# is dependent on the direction of the test and can be performed using either Excel or R.
To calculate the #p#-value of a #z#-test for #\mu# in Excel, make use of one of the following commands:
\[\begin{array}{lllll}
\phantom{0}\text{Direction}&\phantom{0000}H_0&\phantom{0000}H_a&\phantom{000}p\text{-value}&\phantom{0000000000}\text{Excel Command}\\
\hline
\text{Two-tailed}&H_0:\mu = \mu_0&H_a:\mu \neq \mu_0&2\cdot \mathbb{P}(Z\geq |z|)&=2 \text{ * }(1 \text{ - }\text{NORM.DIST}(\text{ABS}(z),0,1,1))\\
\text{Left-tailed}&H_0:\mu \geq \mu_0&H_a:\mu \lt \mu_0&\mathbb{P}(Z\leq z)&=\text{NORM.DIST}(z,0,1,1)\\
\text{Right-tailed}&H_0:\mu \leq \mu_0&H_a:\mu \gt \mu_0&\mathbb{P}(Z\geq z)&=1 \text{ - }\text{NORM.DIST}(z,0,1,1)\\
\end{array}\]
To calculate the #p#-value of a #z#-test for #\mu# in R, make use of one of the following commands:
#\begin{array}{lllll}
\phantom{0}\text{Direction}&\phantom{0000}H_0&\phantom{0000}H_a&\phantom{000}p\text{-value}&\phantom{0000000}\text{R Command}\\
\hline
\text{Two-tailed}&H_0:\mu = \mu_0&H_a:\mu \neq \mu_0&2\cdot \mathbb{P}(Z\geq |z|)&2 \text{ * }\text{pnorm}(\text{abs}(z),0,1, \text{FALSE})\\
\text{Left-tailed}&H_0:\mu \geq \mu_0&H_a:\mu \lt \mu_0&\mathbb{P}(Z\leq z)&\text{pnorm}(z,0,1, \text{TRUE})\\
\text{Right-tailed}&H_0:\mu \leq \mu_0&H_a:\mu \gt \mu_0&\mathbb{P}(Z\geq z)&\text{pnorm}(z,0,1, \text{FALSE})\\
\end{array}#
Note: #|z|# denotes the absolute value of #z#, i.e. the distance of #z# from #0#, regardless of whether #z < 0# or #z > 0#.
#\phantom{0}#
Once the #p#-value of the test has been computed, the time has come to make a decision regarding the null hypothesis #H_0#.
#\phantom{0}#
Making a Decision
If the computed #p#-value is smaller than the significance level (i.e. #p \lt \alpha#), this means that the observed data is highly unlikely to occur, given that #H_0# is true. We then say that we reject #H_0# in favor of #H_a#.
If the computed #p#-value is larger than or equal to the significance level (i.e. #p \geq \alpha#), this means that the observed data falls in the range of values that we would expect to observe if #H_0# is true. We then say we do not reject #H_0#.
A researcher collects one-liter water specimens from #245# randomly-selected locations along a river and measures the amount of dissolved oxygen in each specimen.
The researcher plans on using a #z#-test to determine if the mean oxygen content of the river significantly differs from #6# mg per liter, at the #\alpha = 0.07# level of significance.
The sample mean #\bar{X}# turns out to be #6.01# mg per liter.
Calculate the #p#-value of the test and make a decision regarding #H_0#. Round your answer to #4# decimal places.
On the basis of this #p#-value, #H_0# should not be rejected, because #\,p# #\gt# #\alpha#.
There are a number of different ways we can calculate the #p#-value of the test. Click on one of the panels to toggle a specific solution.
Because the sample is drawn from a normally-distributed population, we know that the test statistic
\[Z=\cfrac{\bar{X} - \mu_0}{\sigma/\sqrt{n}}\]
has the #N(0,1)# distribution, under the assumption that #H_0# is true.
Calculate the value of test statistic #z#:
\[z = \cfrac{\bar{X}-\mu_0}{\sigma/\sqrt{n}} =\cfrac{6.01 - 6}{0.55/\sqrt{245}} = 0.28459\]
For a two-tailed #Z#-test, the #p#-value is defined as #2\cdot \mathbb{P}(Z \geq |z|)#. To calculate this value in Excel, make use of the following function:
NORM.DIST(x, mean, standard_dev, cumulative)
- x: The value at which you wish to evaluate the distribution function.
- mean: The mean of the distribution.
- standard_dev: The standard deviation of the distribution.
- cumulative: A logical value that determines the form of the function.
- TRUE - uses the cumulative distribution function, #\mathbb{P}(X \leq x)#
- FALSE - uses the probability density function
Thus, to calculate #p = 2\cdot \mathbb{P}(Z \geq |z|)#, run the following command:
\[
=2 \text{ * }(1 \text{ - } \text{NORM.DIST}(\text{ABS}(z),0,1,1))\\
\downarrow\\
=2 \text{ * }(1 \text{ - } \text{NORM.DIST}(\text{ABS}(0.28459),0,1,1))
\]
This gives:
\[p = 0.7760\]
Since #\,p# #\gt# #\alpha#, #H_0: \mu = 6# should not be rejected.
Because the sample is drawn from a normally-distributed population, we know that the test statistic
\[Z=\cfrac{\bar{X} - \mu_0}{\sigma/\sqrt{n}}\]
has the #N(0,1)# distribution, under the assumption that #H_0# is true.
Calculate the value of test statistic #z#:
\[z = \cfrac{\bar{X}-\mu_0}{\sigma/\sqrt{n}} =\cfrac{6.01 - 6}{0.55/\sqrt{245}} = 0.28459\]
For a two-tailed #Z#-test, the #p#-value is defined as #2\cdot \mathbb{P}(Z \geq |z|)#. To calculate this value in R, make use of the following function:
pnorm(q, mean, sd, lower.tail)
- q: The value at which you wish to evaluate the distribution function.
- mean: The mean of the distribution.
- sd: The standard deviation of the distribution.
- lower.tail: If TRUE (default), probabilities are #\mathbb{P}(X \leq x)#, otherwise, #\mathbb{P}(X \gt x)#.
Thus, to calculate #p = 2\cdot \mathbb{P}(Z \geq |z|)#, run the following command:
\[
2 \text{ * } \text{pnorm}(q = \text{abs}(z), mean = 0, sd = 1,lower.tail = \text{FALSE})\\
\downarrow\\
2\text{ * } \text{pnorm}(q = \text{abs}(0.28459), mean = 0, sd = 1,lower.tail = \text{FALSE})
\]
This gives:
\[p = 0.7760\]
Since #\,p# #\gt# #\alpha#, #H_0: \mu = 6# should not be rejected.


