7. Hypothesis Testing: Introduction to Hypothesis Testing
 Statistical Power
Statistical Power
The Statistical Power of a test is the probability of rejecting the null hypothesis when it is false.
\[\text{Power} = \mathbb{P}(\text{reject }H_0\,|\,H_0 \text{ is false}) = 1 - \mathbb{P}(\text{Type II error}) = 1 - \beta\]
Statistical Power can be thought of as the sensitivity of the hypothesis test.
#\phantom{0}#
Ideally, you want to have high power to detect practically significant effects, but low power for detecting effects which are not of practical significance. High power can be achieved by using the most powerful statistical procedure available, and then choosing a sufficiently large sample size.
Researchers generally choose a sample size for their research based on the goal of achieving a desired Power level for detecting a particular effect size. For example, a researcher may want at least #75\%# Power for detecting that the true mean is more than #2# units larger than the hypothesized mean #\mu_0#.
#\phantom{0}#
Power Calculation for a One-sample Z-test with Statistical Software
The Power of a hypothesis test can be calculated in either Excel or R.
Consider a left-tailed test of the null hypothesis #H_0: \mu \geq \mu_0# against the alternative hypothesis #H_a: \mu \lt \mu_0# at a significance level #\alpha#.
Suppose the true value of the population mean #\mu# is #\mu_1#, where #\mu_1 \lt \mu_0#. Then we can compute the power of this test by completing the following two steps:
1. Compute how small #\bar{X}# must be to cause #H_0# to be rejected at a significance level #\alpha#. Call this value #Q#:
Excel
\[Q = \mu_0 + \text{NORM.INV}(\alpha, 0, 1) \cdot \cfrac{\sigma}{\sqrt{n}}\]
R
\[Q = \mu_0 + \text{qnorm}(\alpha, 0, 1) \cdot \cfrac{\sigma}{\sqrt{n}}\]
2. Compute the corresponding power:
Excel
\[\text{Power}=\text{NORM.DIST}(Q, \mu_1, \cfrac{\sigma}{\sqrt{n}}, 1)\]
R
\[\text{Power}=\text{pnorm}(Q, \mu_1, \cfrac{\sigma}{\sqrt{n}}, \text{TRUE})\]

#\phantom{0}#
Consider a right-tailed test of the null hypothesis #H_0: \mu \leq \mu_0# against the alternative hypothesis #H_a: \mu \gt \mu_0# at a significance level #\alpha#.
Suppose the true value of the population mean #\mu# is #\mu_1#, where #\mu_1 \gt \mu_0#. Then we can compute the power of this test by completing the following two steps:
1. Compute how large #\bar{X}# must be to cause #H_0# to be rejected at a significance level #\alpha#. Call this value #Q#:
Excel
\[Q = \mu_0 + \text{NORM.INV}(1-\alpha, 0, 1) \cdot \cfrac{\sigma}{\sqrt{n}}\]
R
\[Q = \mu_0 + \text{qnorm}(1 - \alpha, 0, 1) \cdot \cfrac{\sigma}{\sqrt{n}}\]
2. Compute the corresponding power:
Excel
\[\text{Power}=1-\text{NORM.DIST}(Q, \mu_1, \cfrac{\sigma}{\sqrt{n}}, 1)\]
R
\[\text{Power}=\text{pnorm}(Q, \mu_1, \cfrac{\sigma}{\sqrt{n}}, \text{FALSE})\]

She obtains a random sample of size #n = 64# from from a population with unknown mean #\mu# and standard deviation #\sigma = 9#.
Suppose the true value of #\mu# is #51#.
What is the Power of the test? Round your answer to #3# decimal places.
There are a number of different ways we can calculate the Power of the test. Click on one of the panels to toggle a specific solution.
Let #\mu_1# denote the true population mean, then #\mu_1 = 51#.
Compute how small #\bar{X}# must be to cause #H_0# to be rejected at the #\alpha = 0.03# level of significance:
\[\begin{array}{rcl}
Q &=& \mu_0 + \text{NORM.INV}(\alpha, 0, 1) \cdot \cfrac{\sigma}{\sqrt{n}}\\
&=& 54 + \text{NORM.INV}(0.03, 0, 1) \cdot \cfrac{9}{\sqrt{64}}\\
&=& 51.88411
\end{array}\]
Compute the Power:
\[\begin{array}{rcl}
\text{Power} &=& \text{NORM.DIST}(Q, \mu_1, \cfrac{\sigma}{\sqrt{n}}, 1)\\
&=& \text{NORM.DIST}(51.88411, 51, \cfrac{9}{\sqrt{64}}, 1)\\
&=& 0.784
\end{array}\]
Let #\mu_1# denote the true population mean, then #\mu_1 = 51#.
Compute how small #\bar{X}# must be to cause #H_0# to be rejected at the #\alpha = 0.03# level of significance:
\[\begin{array}{rcl}
Q &=& \mu_0 + \text{qnorm}(\alpha, 0, 1) \cdot \cfrac{\sigma}{\sqrt{n}}\\
&=& 54 + \text{qnorm}(0.03, 0, 1) \cdot \cfrac{9}{\sqrt{64}}\\
&=& 51.88411
\end{array}\]
Compute the Power:
\[\begin{array}{rcl}
\text{Power} &=& \text{pnorm}(Q, \mu_1, \cfrac{\sigma}{\sqrt{n}}, \text{TRUE})\\
&=& \text{pnorm}(51.88411, 51, \cfrac{9}{\sqrt{64}}, \text{TRUE})\\
&=& 0.784
\end{array}\]
#\phantom{0}#
Power Curve
Often, a Power curve is used to investigate the relationship between Power and effect size for a specified sample size, significance level, or standard deviation.
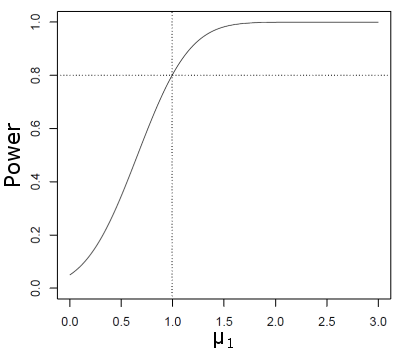
For example, below is the Power curve for the test #H_0: \mu \leq 0# against #H_a: \mu \gt 0# at the #\alpha=0.05# level of significance, when #\sigma = 4# and #n=100#. Here, #\mu_1# denotes the true value of the population mean #\mu#.
Note that for an effect size of #0#, the Power always equals the significance level (in this case, #0.05#).
The Power steadily increases as the effect size increases, reaching a target Power of #0.8# when the effect size equals #1#.
The Power then levels off towards the maximum Power of #1.0# for larger effect sizes.
Modifying #n, \alpha,# or #\sigma# will change the shape of the Power curve. For a given effect size, the Power will be higher if:
- The sample size #n# increases.
- The significance level #\alpha# increases.
- The population standard deviation #\sigma# decreases.