7. Hypothesis Testing: Practical 7
 Introduction to Air Quality Case Study
Objectives
Learn how to apply statistical null hypothesis testing in R to evaluate whether
- a population mean differs from a prior value
- a population proportion differs from a prior value
Instruction
- Read through the text below
- Execute code-examples and compare your results with what is explained in the text
- Make the exercises
- Time: 60 minutes
Air quality
Air quality is the ultimate common good: we all rely on it, but through our economic activity (e.g. transport, industry, but also some forms of agriculture) we also reduce it. It is the ultimate task of a central government to ensure that air quality is not deteriorating so much that it causes too high health risks (or costs) for its inhabitants and to take actions if it does happen.
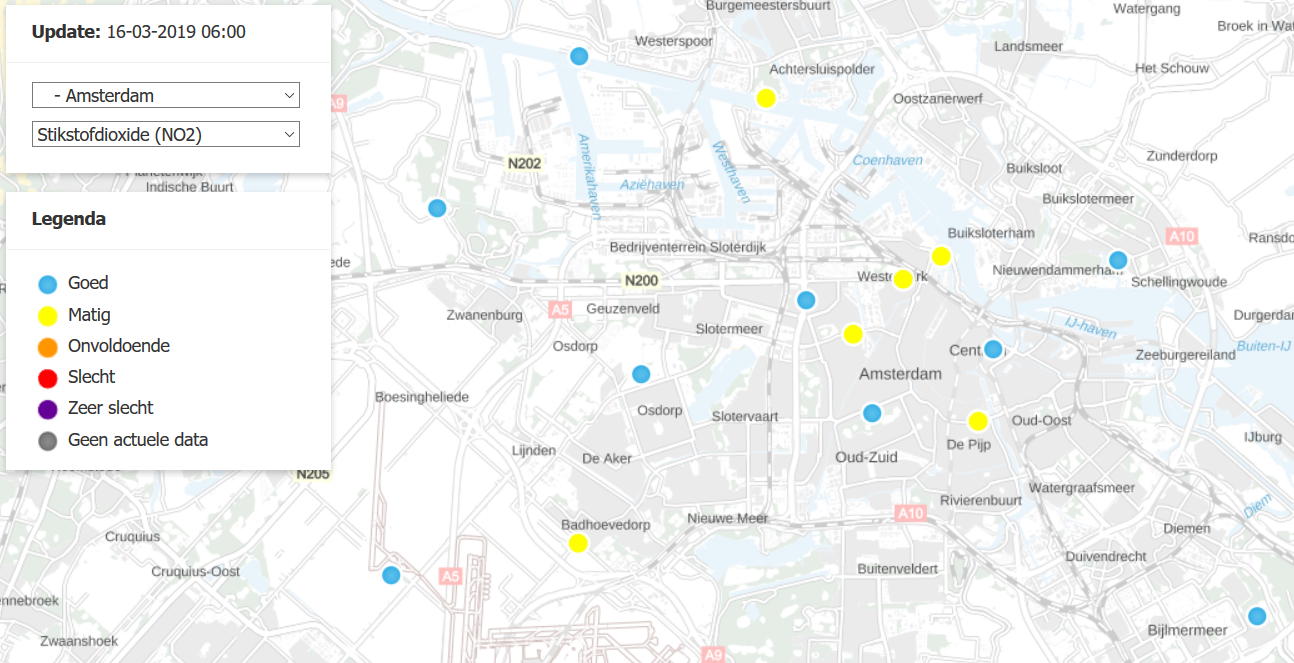
Fortunately, in the Netherlands, the regional and national government does play this role and actively monitors air quality for the protection of its inhabitants. In Amsterdam the measurement network consists of 15 air quality monitoring stations placed throughout the City (see Figure 1).

Figure 1. Contemporary air quality in Amsterdam (shown for NO2). Source: https://www.luchtmeetnet.nl/stations/noord-holland/amsterdam/NO2.
In total 14 different air quality indicators are measured, although not all indicators are measured at each station. In this practicum, we will focus on two indicators only; Nitrogen Dioxide (NO2) and Particulate Matter (PM10).
Monitoring nitrogen dioxide concentrations is important, because high concentrations can cause problems with the respiratory system and nitrogen dioxide is one of the compounds causing acid rain. While a small portion of nitrogen dioxide comes from natural sources, the major part forms from emissions from traffic and industry. In Amsterdam, the concentrations of NO2 are therefore higher during weekdays than in the weekend. The legal standard for NO2 is a yearly average concentration of #40# (μg/m3).
Particulate matter is the term for a mixture of solid particles and liquid droplets found in the air. Some particles, such as dust, dirt, or smoke, are large or dark enough to be seen with the naked eye. Others are so small they can only be detected using an electron microscope. PM10 comprises inhalable particles with diameters that are generally 10 micrometers and smaller. The legal standard for PM10 is a yearly average concentration of #40# (μg/m3). In addition, the daily average is allowed maximum 35 times over #50# (μg/m3).
More background information can be found at: https://www.ggd.amsterdam.nl/gezond-wonen/luchtkwaliteit/
https://www.amsterdam.nl/parkeren-verkeer/luchtkwaliteit/gezonde-lucht/


