6. Parameter Estimation and Confidence Intervals: Estimation
 Confidence Interval for the Population Mean
A confidence interval for a population mean #\mu# is a range of values, based on sample data, which are highly plausible candidates for the true value of the population mean.
To construct a confidence interval for a population mean #\mu#, we will need to make use of the sampling distribution of the sample mean.
Remember that the sample mean #\bar{X}# (approximately) follows the #N\bigg(\mu, \cfrac{\sigma}{\sqrt{n}}\,\bigg)# distribution if at least one of the following conditions is satisfied:
- The population from which the sample is drawn is normally distributed
- The sample is large enough for the Central Limit Theorem to apply: #n\geq 30#
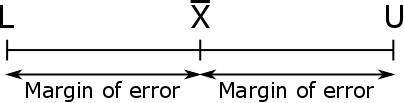
The width of a confidence interval is determined by the margin of error.
#\phantom{0}#
Margin of Error
The margin of error #(ME)# of a confidence interval for the population mean #\mu# is the distance from the center of the interval #\bar{X}# to either the lower bound #L# or the upper bound #U#.
To calculate the margin of error of a confidence interval for the population mean #\mu#, use the following formula:
\[\begin{array}{rcccl}ME &=& z^* \cdot \sigma_{\bar{X}} &=& z^* \cdot \cfrac{\sigma}{\sqrt{n}}\end{array}\]
Where #z^*# is the critical value of the Standard Normal Distribution such that:
\[\mathbb{P}(-z^* \leq Z \leq z^*) = \cfrac{C}{100}\]

Calculating z* with Statistical Software
Let #C# be the confidence level in #\%#.
To calculate the critical value #z^*# in Excel, make use of the function NORM.INV():
\[=\text{NORM.INV}((100+C)/200, 0, 1)\]
To calculate the critical value #z^*# in R, make use of the function qnorm():
\[\text{qnorm}(p=(100+C)/200, mean=0, sd=1,lower.tail = \text{TRUE})\]
Factors that Influence the Margin of Error
The margin of error of a confidence interval for the population mean #\mu# is dependent on #3# factors: the confidence level, the population standard deviation, and the sample size.
- As the confidence level increases, the margin of error increases and the confidence interval becomes wider.
- As the population standard deviation increases, the margin of error increases and the confidence interval becomes wider.
- As the sample size increases, the margin of error decreases and the confidence interval becomes narrower.
A researcher randomly selects #93# men from this age group and finds a mean BP of #\bar{X}=125.71#.
Calculate the margin of error of the #96\%# confidence interval for the population mean #\mu#. Round your answer to #3# decimal places.
#ME=3.407#
There are a number of different ways we can calculate the margin of error. Click on one of the panels to toggle a specific solution.
The margin of error of a confidence interval for a population mean #\mu# is calculated with the following formula:
\[ME=z^* \cdot \sigma_{\bar{X}}\]
Since the population from which the sample is drawn is normally distributed, we know that the sampling distribution of the sample mean is the #N(\mu, \sigma / \sqrt{n})# distribution.
Determine the standard error of the mean #\sigma_{\bar{X}}#:
\[\sigma_{\bar{X}}=\cfrac{\sigma}{\sqrt{n}}=\cfrac{16}{\sqrt{93}}=1.65912\]
For a given confidence level #C#, the critical value #z^*# of the standard normal distribution is the value such that #\mathbb{P}(-z^* \leq Z \leq z^*)=\cfrac{C}{100}#.
To calculate this critical value #z^*# in Excel, make use of the following function:
NORM.INV(probability, mean, standard_dev)
- probability: A probability corresponding to the normal distribution.
- mean: The mean of the distribution.
- standard_dev: The standard deviation of the distribution.
Here, we have #C=96#. Thus, to calculate #z^*# such that #\mathbb{P}(-z^* \leq Z \leq z^*)=0.96#, run the following command:
\[\begin{array}{c}
=\text{NORM.INV}((100+C)/200, 0, 1)\\
\downarrow\\
=\text{NORM.INV}(196/200, 0, 1)
\end{array}\]
This gives:
\[z^* = 2.05375\]
With this information, the margin of error can be calculated:
\[ME=z^* \cdot \sigma_{\bar{X}} = 2.05375 \cdot 1.65912 = 3.407\]
The margin of error of a confidence interval for the population mean #\mu# is calculated with the following formula:
\[ME=z^* \cdot \sigma_{\bar{X}}\]
Since the population from which the sample is drawn is normally distributed, we know that the sampling distribution of the sample mean is the #N(\mu, \sigma / \sqrt{n})# distribution.
Determine the standard error of the mean #\sigma_{\bar{X}}#:
\[\sigma_{\bar{X}}=\cfrac{\sigma}{\sqrt{n}}=\cfrac{16}{\sqrt{93}}=1.65912\]
For a given confidence level #C#, the critical value #z^*# of the standard normal distribution is the value such that #\mathbb{P}(-z^* \leq Z \leq z^*)=\cfrac{C}{100}#.
To calculate this critical value #z^*# in R, make use of the following function:
qnorm(p, mean, sd, lower.tail)
- p: A probability corresponding to the normal distribution.
- mean: The mean of the distribution.
- sd: The standard deviation of the distribution.
- lower.tail: If TRUE (default), probabilities are #\mathbb{P}(X \leq x)#, otherwise, #\mathbb{P}(X \gt x)#.
Here, we have #C=96#. Thus, to calculate #z^*#such that #\mathbb{P}(-z^* \leq Z \leq z^*)=0.96#, run the following command:
\[\begin{array}{c}
\text{qnorm}(p = (100+C)/200, mean = 0, sd = 1, lower.tail = \text{TRUE})\\
\downarrow\\
\text{qnorm}(p =196/200, mean = 0, sd = 1, lower.tail = \text{TRUE})
\end{array}\]
This gives:
\[z^* = 2.05375\]
With this information, the margin of error can be calculated:
\[ME=z^* \cdot \sigma_{\bar{X}} = 2.05375 \cdot 1.65912 = 3.407\]
#\phantom{0}#
General Formula for a Confidence Interval for a Population Mean
Assuming the sampling distribution of the sample mean is (approximately) normal, the general formula for computing a #C\%# CI for the population mean #\mu#, based on a random sample of size #n#, is:
\[CI_{\mu}=\bigg(\bar{X} - z^*\cdot \cfrac{\sigma}{\sqrt{n}},\,\,\,\, \bar{X} + z^*\cdot \cfrac{\sigma}{\sqrt{n}} \bigg)\]
Assume the standard deviation in weight for a single one-euro coin is #\sigma=0.0571#.
Construct a #91\%# confidence interval for the population mean #\mu#. Round your answers to #3# decimal places.
There are a number of different ways we can compute the confidence interval. Click on one of the panels to toggle a specific solution.
A sample size of #n=1000# is considered large enough for the Central Limit Theorem to apply.
This means that, although the sample in question comes from a population having an unknown distribution, the sampling distribution of the sample mean is approximately normal.
Assuming the sampling distribution of the sample mean is (approximately) normal, the general formula for computing a #C\%\, CI# for a population mean #\mu#, based on a random sample of size #n#, is:
\[CI_{\mu}=\bigg(\bar{X} - z^*\cdot \cfrac{\sigma}{\sqrt{n}},\,\,\,\, \bar{X} + z^*\cdot \cfrac{\sigma}{\sqrt{n}} \bigg)\]
For a given confidence level #C#, the critical value #z^*# of the standard normal distribution is the value such that #\mathbb{P}(-z^* \leq Z \leq z^*)=\cfrac{C}{100}#.
To calculate this critical value #z^*# in Excel, make use of the following function:
NORM.INV(probability, mean, standard_dev)
- probability: A probability corresponding to the normal distribution.
- mean: The mean of the distribution.
- standard_dev: The standard deviation of the distribution.
Here, we have #C=91#. Thus, to calculate #z^*# such that #\mathbb{P}(-z^* \leq Z \leq z^*)=0.91#, run the following command:
\[\begin{array}{c}
=\text{NORM.INV}((100+C)/200, 0, 1)\\
\downarrow\\
=\text{NORM.INV}(191/200, 0, 1)
\end{array}\]
This gives:
\[z^* = 1.69540\]
Calculate the lower bound #L# of the confidence interval:
\[L = \bar{X} - z^* \cdot \cfrac{\sigma}{\sqrt{n}} = 2.360 - 1.69540 \cdot \cfrac{0.0571}{\sqrt{1000}}=2.357\]
Calculate the lower bound #U# of the confidence interval:
\[U = \bar{X} + z^* \cdot \cfrac{\sigma}{\sqrt{n}} = 2.360 + 1.69540 \cdot \cfrac{0.0571}{\sqrt{1000}}=2.363\]
Thus, the #91\%# confidence interval for the population mean #\mu# is:
\[CI_{\mu,\,91\%}=(2.357,\,\,\, 2.363)\]
A sample size of #n=1000# is considered large enough for the Central Limit Theorem to apply.
This means that, although the sample in question comes from a population having an unknown distribution, the sampling distribution of the sample mean is approximately normal.
Assuming the sampling distribution of the sample mean is (approximately) normal, the general formula for computing a #C\%\, CI# for a population mean #\mu#, based on a random sample of size #n#, is:
\[CI_{\mu}=\bigg(\bar{X} - z^*\cdot \cfrac{\sigma}{\sqrt{n}},\,\,\,\, \bar{X} + z^*\cdot \cfrac{\sigma}{\sqrt{n}} \bigg)\]
For a given confidence level #C#, the critical value #z^*# of the standard normal distribution is the value such that #\mathbb{P}(-z^* \leq Z \leq z^*)=\cfrac{C}{100}#.
To calculate this critical value #z^*# in R, make use of the following function:
qnorm(p, mean, sd, lower.tail)
- p: A probability corresponding to the normal distribution.
- mean: The mean of the distribution.
- sd: The standard deviation of the distribution.
- lower.tail: If TRUE (default), probabilities are #\mathbb{P}(X \leq x)#, otherwise, #\mathbb{P}(X \gt x)#.
Here, we have #C=91#. Thus, to calculate #z^*#such that #\mathbb{P}(-z^* \leq Z \leq z^*)=0.91#, run the following command:
\[\begin{array}{c}
\text{qnorm}(p = (100+C)/200, mean = 0, sd = 1, lower.tail = \text{TRUE})\\
\downarrow\\
\text{qnorm}(p =191/200, mean = 0, sd = 1, lower.tail = \text{TRUE})
\end{array}\]
This gives:
\[z^* = 1.69540\]
Calculate the lower bound #L# of the confidence interval:
\[L = \bar{X} - z^* \cdot \cfrac{\sigma}{\sqrt{n}} = 2.360 - 1.69540 \cdot \cfrac{0.0571}{\sqrt{1000}}=2.357\]
Calculate the lower bound #U# of the confidence interval:
\[U = \bar{X} + z^* \cdot \cfrac{\sigma}{\sqrt{n}} = 2.360 + 1.69540 \cdot \cfrac{0.0571}{\sqrt{1000}}=2.363\]
Thus, the #91\%# confidence interval for the population mean #\mu# is:
\[CI_{\mu,\,91\%}=(2.357,\,\,\, 2.363)\]
#\phantom{0}#
Controlling the Margin of Error
Suppose you would like the margin of error for a #C\%# confidence interval for the population mean #\mu# to be no larger than #k#.
Then the minimum sample size required is:
\[n=\Big(\cfrac{z^* \cdot \sigma}{k}\Big)^2,\]
rounded up to the next whole number.
If the researcher wants the margin of error of the #94\%# confidence interval for the population mean #\mu# to be no larger than #1#, what is the minimum sample size he needs?
#n \geq 1147#
There are a number of different ways we can calculate the minimum sample size. Click on one of the panels to toggle a specific solution.
For a given confidence level #C#, the critical value #z^*# of the standard normal distribution is the value such that #\mathbb{P}(-z^* \leq Z \leq z^*)=\cfrac{C}{100}#.
To calculate this critical value #z^*# in Excel, make use of the following function:
NORM.INV(probability, mean, standard_dev)
- probability: A probability corresponding to the normal distribution.
- mean: The mean of the distribution.
- standard_dev: The standard deviation of the distribution.
Here, we have #C=94#. Thus, to calculate #z^*# such that #\mathbb{P}(-z^* \leq Z \leq z^*)=0.94#, run the following command:
\[\begin{array}{c}
=\text{NORM.INV}((100+C)/200, 0, 1)\\
\downarrow\\
=\text{NORM.INV}(194/200, 0, 1)
\end{array}\]
This gives:
\[z^* = 1.88079\]
With this information, the minimum sample size can be calculated:
\[n=\Big(\cfrac{z^* \cdot \sigma}{k}\Big)^2=\Big(\cfrac{1.88079 \cdot 18}{1}\Big)^2=1146.1126\]
Rounding this value up gives #n=1147#.
Thus, to obtain a margin of error no larger than #1#, you need a sample size of at least #1147#.
For a given confidence level #C#, the critical value #z^*# of the standard normal distribution is the value such that #\mathbb{P}(-z^* \leq Z \leq z^*)=\cfrac{C}{100}#.
To calculate this critical value #z^*# in R, make use of the following function:
qnorm(p, mean, sd, lower.tail)
- p: A probability corresponding to the normal distribution.
- mean: The mean of the distribution.
- sd: The standard deviation of the distribution.
- lower.tail: If TRUE (default), probabilities are #\mathbb{P}(X \leq x)#, otherwise, #\mathbb{P}(X \gt x)#.
Here, we have #C=94#. Thus, to calculate #z^*#such that #\mathbb{P}(-z^* \leq Z \leq z^*)=0.94#, run the following command:
\[\begin{array}{c}
\text{qnorm}(p = (100+C)/200, mean = 0, sd = 1, lower.tail = \text{TRUE})\\
\downarrow\\
\text{qnorm}(p =194/200, mean = 0, sd = 1, lower.tail = \text{TRUE})
\end{array}\]
This gives:
\[z^* = 1.88079\]
With this information, the minimum sample size can be calculated:
\[n=\Big(\cfrac{z^* \cdot \sigma}{k}\Big)^2=\Big(\cfrac{1.88079 \cdot 18}{1}\Big)^2=1146.1126\]
Rounding this value up gives #n=1147#.
Thus, to obtain a margin of error no larger than #1#, you need a sample size of at least #1147#.


