6. Parameter Estimation and Confidence Intervals: Estimation
 Confidence Interval for the Population Proportion
A confidence interval for the population proportion #\pi# is a range of values, based on sample data, which are highly plausible candidates for the true value of the population proportion.
To construct a confidence interval for the population proportion #\pi#, we will need to make use of the sampling distribution of the sample proportion.
Remember that the sample proportion #\hat{p}# (approximately) follows the #N\bigg(\pi, \sqrt{\cfrac{\pi \cdot (1-\pi)}{n}}\,\bigg)# distribution if both of the following conditions are satisfied:
- There are at least 10 positive cases: #n\cdot \pi \geq 10#
- There are at least 10 negative cases: #n\cdot (1-\pi) \geq 10#
The problem, however, is that since the value of #\pi# is unknown, we cannot use it to check the conditions for normality.
The solution is to use the sample proportion #\hat{p}# as an estimate for the population proportion #\pi# and check the conditions for normality using #\hat{p}# instead.
Likewise, without knowing #\pi#, we cannot compute the standard error of the proportion #\sigma_{\hat{p}}#. Instead, we will use the estimated standard error of the proportion #s_{\hat{p}}# in the calculation of a confidence interval for the population proportion #\pi#:
\[s_{\hat{p}} =\sqrt{\cfrac{\hat{p}\cdot (1-\hat{p})}{n}}\]
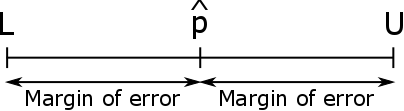
The width of a confidence interval is determined by the margin of error.
#\phantom{0}#
Margin of Error
The margin of error #(ME)# of a confidence interval for the population proportion #\pi# is the distance from the center of the interval #\hat{p}# to either the lower bound #L# or the upper bound #U#.
To calculate the margin of error of a confidence interval for the population proportion #\pi#, use the following formula:
\[\begin{array}{rcccl}ME &=& z^* \cdot s_{\hat{p}} &=& z^* \cdot \sqrt{\cfrac{\hat{p}\cdot(1-\hat{p})}{n}}\end{array}\]
Where #z^*# is the critical value of the Standard Normal Distribution such that #\mathbb{P}(-z^* \leq Z \leq z^*) = \cfrac{C}{100})#.

Calculating z* with Statistical Software
Let #C# be the confidence level in #\%#.
To calculate the critical value #z^*# in Excel, make use of the function NORM.INV():
\[=\text{NORM.INV}((100+C)/200, 0, 1)\]
To calculate the critical value #z^*# in R, make use of the function qnorm():
\[\text{qnorm}(p=(100+C)/200, mean=0, sd=1,lower.tail = \text{TRUE})\]
Factors that Influence the Margin of Error
The margin of error of a confidence interval for the population proportion #\pi# is dependent on #3# factors: the confidence level, the sample proportion, and the sample size.
- As the confidence level increases, the margin of error increases and the confidence interval becomes wider.
- As the sample proportion approaches a value of #0.5# (from either side), the margin of error increases and the confidence interval becomes wider.
- As the sample size increases, the margin of error decreases and the confidence interval becomes narrower.
He randomly selects a sample of #350# from this population and finds that #X=28# of them are vegetarian/vegan.
Calculate the margin of error of the #91\%# confidence interval for the population proportion #\pi#. Round your answer to #3# decimal places.
#ME=0.025#
There are a number of different ways we can calculate the margin of error. Click on one of the panels to toggle a specific solution.
The margin of error of a confidence interval for the population proportion #\pi# is calculated with the following formula:
\[ME=z^* \cdot s_{\hat{p}}\]
Calculate the sample proportion #\hat{p}#:
\[\hat{p}=\cfrac{X}{n}=\cfrac{28}{350}=0.08\]
Investigate whether the sampling distribution of the sample proportion may be considered approximately normal:
- #n\cdot \hat{p} = 350 \cdot 0.08 = 28 \geq 10#
- #n\cdot (1 -\hat{p}) = 350 \cdot (1-0.08) = 322 \geq 10#
Since both conditions are satisfied, the sampling distribution of the sample proportion is approximately normally distributed with parameters #\mu_{\hat{p}}=\pi# and #\sigma_{\hat{p}}=\sqrt{\cfrac{\pi \cdot (1 - \pi)}{n}}#.
However, because the population proportion #\pi# is unknown, the standard error of the proportion #\sigma_{\hat{p}}# cannot be calculated.
Instead, we will use the sample proportion #\hat{p}# to calculate the estimated standard error of the proportion #s_{\hat{p}}#:
\[s_{\hat{p}}=\sqrt{\cfrac{\hat{p} \cdot (1 - \hat{p})}{n}} = \sqrt{\cfrac{0.08 \cdot (1 -0.08)}{350}} = 0.01450\]
For a given confidence level #C#, the critical value #z^*# of the standard normal distribution is the value such that #\mathbb{P}(-z^* \leq Z \leq z^*)=\cfrac{C}{100}#.
To calculate this critical value #z^*# in Excel, make use of the following function:
NORM.INV(probability, mean, standard_dev)
- probability: A probability corresponding to the normal distribution.
- mean: The mean of the distribution.
- standard_dev: The standard deviation of the distribution.
Here, we have #C=91#. Thus, to calculate #z^*# such that #\mathbb{P}(-z^* \leq Z \leq z^*)=0.91#, run the following command:
\[\begin{array}{c}
=\text{NORM.INV}((100+C)/200, 0, 1)\\
\downarrow\\
=\text{NORM.INV}(191/200, 0, 1)
\end{array}\]
This gives:
\[z^* = 1.69540\]
With this information, the margin of error can be calculated:
\[ME=z^* \cdot s_{\hat{p}} = 1.69540 \cdot 0.01450 = 0.025\]
The margin of error of a confidence interval for the population proportion #\pi# is calculated with the following formula:
\[ME=z^* \cdot s_{\hat{p}}\]
Calculate the sample proportion #\hat{p}#:
\[\hat{p}=\cfrac{X}{n}=\cfrac{28}{350}=0.08\]
Investigate whether the sampling distribution of the sample proportion may be considered approximately normal:
- #n\cdot \hat{p} = 350 \cdot 0.08 = 28 \geq 10#
- #n\cdot (1 -\hat{p}) = 350 \cdot (1-0.08) = 322 \geq 10#
Since both conditions are satisfied, the sampling distribution of the sample proportion is approximately normally distributed with parameters #\mu_{\hat{p}}=\pi# and #\sigma_{\hat{p}}=\sqrt{\cfrac{\pi \cdot (1 - \pi)}{n}}#.
However, because the population proportion #\pi# is unknown, the standard error of the proportion #\sigma_{\hat{p}}# cannot be calculated.
Instead, we will use the sample proportion #\hat{p}# to calculate the estimated standard error of the proportion #s_{\hat{p}}#:
\[s_{\hat{p}}=\sqrt{\cfrac{\hat{p} \cdot (1 - \hat{p})}{n}} = \sqrt{\cfrac{0.08 \cdot (1 -0.08)}{350}} = 0.01450\]
For a given confidence level #C#, the critical value #z^*# of the standard normal distribution is the value such that #\mathbb{P}(-z^* \leq Z \leq z^*)=\cfrac{C}{100}#.
To calculate this critical value #z^*# in R, make use of the following function:
qnorm(p, mean, sd, lower.tail)
- p: A probability corresponding to the normal distribution.
- mean: The mean of the distribution.
- sd: The standard deviation of the distribution.
- lower.tail: If TRUE (default), probabilities are #\mathbb{P}(X \leq x)#, otherwise, #\mathbb{P}(X \gt x)#.
Here, we have #C=91#. Thus, to calculate #z^*#such that #\mathbb{P}(-z^* \leq Z \leq z^*)=0.91#, run the following command:
\[\begin{array}{c}
\text{qnorm}(p = (100+C)/200, mean = 0, sd = 1, lower.tail = \text{TRUE})\\
\downarrow\\
\text{qnorm}(p =191/200, mean = 0, sd = 1, lower.tail = \text{TRUE})
\end{array}\]
This gives:
\[z^* = 1.69540\]
With this information, the margin of error can be calculated:
\[ME=z^* \cdot s_{\hat{p}} = 1.69540 \cdot 0.01450 = 0.025\]
#\phantom{0}#
General Formula for a Confidence Interval for the Population Proportion
Assuming the sampling distribution of the sample proportion is (approximately) normal, the general formula for computing a #C\%\,CI# for the population proportion #\pi#, based on a random sample of size #n#, is:
\[CI_{\pi}=\bigg(\hat{p} - z^*\cdot \sqrt{\cfrac{\hat{p}\cdot(1-\hat{p})}{n}},\,\,\,\, \hat{p} + z^*\cdot \sqrt{\cfrac{\hat{p}\cdot(1-\hat{p})}{n}} \bigg)\]
Of these, #X=784# cultures showed some resistance to penicillin.
Construct a #96\%# confidence interval for the proportion of strep cultures among all Florida patients that are penicillin-resistant. Round your answers to #3# decimal places.
There are a number of different ways we can compute the confidence interval. Click on one of the panels to toggle a specific solution.
Calculate the sample proportion #\hat{p}#:
\[\hat{p}=\cfrac{X}{n}=\cfrac{784}{1568}=0.5000\]
Investigate whether the sampling distribution of the sample proportion may be considered approximately normal:
- #n\cdot \hat{p} = 1568 \cdot 0.5000 = 784 \geq 10#
- #n\cdot (1 -\hat{p}) = 1568 \cdot (1-0.5000) = 784 \geq 10#
Since both conditions are satisfied, the sampling distribution of the sample proportion is approximately normal.
Assuming the sampling distribution of the sample proportion is (approximately) normal, the general formula for computing a #C\%\,CI# for the population proportion #\pi#, based on a random sample of size #n#, is:
\[CI_{\pi}=\bigg(\hat{p} - z^*\cdot \sqrt{\cfrac{\hat{p}\cdot(1-\hat{p})}{n}},\,\,\,\, \hat{p} + z^*\cdot \sqrt{\cfrac{\hat{p}\cdot(1-\hat{p})}{n}} \bigg)\]
For a given confidence level #C#, the critical value #z^*# of the standard normal distribution is the value such that #\mathbb{P}(-z^* \leq Z \leq z^*)=\cfrac{C}{100}#.
To calculate this critical value #z^*# in Excel, make use of the following function:
NORM.INV(probability, mean, standard_dev)
- probability: A probability corresponding to the normal distribution.
- mean: The mean of the distribution.
- standard_dev: The standard deviation of the distribution.
Here, we have #C=96#. Thus, to calculate #z^*# such that #\mathbb{P}(-z^* \leq Z \leq z^*)=0.96#, run the following command:
\[\begin{array}{c}
=\text{NORM.INV}((100+C)/200, 0, 1)\\
\downarrow\\
=\text{NORM.INV}(196/200, 0, 1)
\end{array}\]
This gives:
\[z^* = 2.0537\]
Calculate the lower bound #L# of the confidence interval:
\[L = \hat{p} - z^*\cdot \sqrt{\cfrac{\hat{p}\cdot(1-\hat{p})}{n}} = 0.5000 - 2.0537 \cdot \sqrt{\cfrac{0.5000 \cdot (1-0.5000)}{1568}} = 0.474\]
Calculate the lower bound #U# of the confidence interval:
\[U = \hat{p} + z^*\cdot \sqrt{\cfrac{\hat{p}\cdot(1-\hat{p})}{n}} = 0.5000 + 2.0537 \cdot \sqrt{\cfrac{0.5000 \cdot (1-0.5000)}{1568}} = 0.526\]
Thus, the #96\%# confidence interval for the population proportion #\pi# is:
\[CI_{\pi,\,96\%}=(0.474,\,\,\, 0.526)\]
Calculate the sample proportion #\hat{p}#:
\[\hat{p}=\cfrac{X}{n}=\cfrac{784}{1568}=0.5000\]
Investigate whether the sampling distribution of the sample proportion may be considered approximately normal:
- #n\cdot \hat{p} = 1568 \cdot 0.5000 = 784 \geq 10#
- #n\cdot (1 -\hat{p}) = 1568 \cdot (1-0.5000) = 784 \geq 10#
Since both conditions are satisfied, the sampling distribution of the sample proportion is approximately normal.
Assuming the sampling distribution of the sample proportion is (approximately) normal, the general formula for computing a #C\%\,CI# for the population proportion #\pi#, based on a random sample of size #n#, is:
\[CI_{\pi}=\bigg(\hat{p} - z^*\cdot \sqrt{\cfrac{\hat{p}\cdot(1-\hat{p})}{n}},\,\,\,\, \hat{p} + z^*\cdot \sqrt{\cfrac{\hat{p}\cdot(1-\hat{p})}{n}} \bigg)\]
For a given confidence level #C#, the critical value #z^*# of the standard normal distribution is the value such that #\mathbb{P}(-z^* \leq Z \leq z^*)=\cfrac{C}{100}#.
To calculate this critical value #z^*# in R, make use of the following function:
qnorm(p, mean, sd, lower.tail)
- p: A probability corresponding to the normal distribution.
- mean: The mean of the distribution.
- sd: The standard deviation of the distribution.
- lower.tail: If TRUE (default), probabilities are #\mathbb{P}(X \leq x)#, otherwise, #\mathbb{P}(X \gt x)#.
Here, we have #C=96#. Thus, to calculate #z^*#such that #\mathbb{P}(-z^* \leq Z \leq z^*)=0.96#, run the following command:
\[\begin{array}{c}
\text{qnorm}(p = (100+C)/200, mean = 0, sd = 1, lower.tail = \text{TRUE})\\
\downarrow\\
\text{qnorm}(p =196/200, mean = 0, sd = 1, lower.tail = \text{TRUE})
\end{array}\]
This gives:
\[z^* = 2.0537\]
Calculate the lower bound #L# of the confidence interval:
\[L = \hat{p} - z^*\cdot \sqrt{\cfrac{\hat{p}\cdot(1-\hat{p})}{n}} = 0.5000 - 2.0537 \cdot \sqrt{\cfrac{0.5000 \cdot (1-0.5000)}{1568}} = 0.474\]
Calculate the lower bound #U# of the confidence interval:
\[U = \hat{p} + z^*\cdot \sqrt{\cfrac{\hat{p}\cdot(1-\hat{p})}{n}} = 0.5000 + 2.0537 \cdot \sqrt{\cfrac{0.5000 \cdot (1-0.5000)}{1568}} = 0.526\]
Thus, the #96\%# confidence interval for the population proportion #\pi# is:
\[CI_{\pi,\,96\%}=(0.474,\,\,\, 0.526)\]
#\phantom{0}#
Controlling the Margin of Error
Suppose you would like the margin of error for a #C\%# confidence interval for the population proportion #\pi# to be no larger than #k#.
Then the minimum sample size required is
\[n=0.25 \cdot \Big(\cfrac{z^*}{k}\Big)^2,\]
rounded up to the next whole number.
If the researcher wants the margin of error of the #91\%# confidence interval for the population proportion #\pi# to be no larger than #0.03#, what is the minimum sample size she needs to achieve this goal?
#n \geq 799#
There are a number of different ways we can calculate the minimum sample size. Click on one of the panels to toggle a specific solution.
For a given confidence level #C#, the critical value #z^*# of the standard normal distribution is the value such that #\mathbb{P}(-z^* \leq Z \leq z^*)=\cfrac{C}{100}#.
To calculate this critical value #z^*# in Excel, make use of the following function:
NORM.INV(probability, mean, standard_dev)
- probability: A probability corresponding to the normal distribution.
- mean: The mean of the distribution.
- standard_dev: The standard deviation of the distribution.
Here, we have #C=91#. Thus, to calculate #z^*# such that #\mathbb{P}(-z^* \leq Z \leq z^*)=0.91#, run the following command:
\[\begin{array}{c}
=\text{NORM.INV}((100+C)/200, 0, 1)\\
\downarrow\\
=\text{NORM.INV}(191/200, 0, 1)
\end{array}\]
This gives:
\[z^* = 1.6954\]
With this information, the minimum sample size can be calculated:
\[n=0.25 \cdot \Big(\cfrac{z^*}{k}\Big)^2=\Big(\cfrac{1.6954}{0.03}\Big)^2=798.437\]
Rounding this value up gives #n=799#.
Thus, for the margin of error to be no larger than #0.03#, you need a sample size of at least #799#.
For a given confidence level #C#, the critical value #z^*# of the standard normal distribution is the value such that #\mathbb{P}(-z^* \leq Z \leq z^*)=\cfrac{C}{100}#.
To calculate this critical value #z^*# in R, make use of the following function:
qnorm(p, mean, sd, lower.tail)
- p: A probability corresponding to the normal distribution.
- mean: The mean of the distribution.
- sd: The standard deviation of the distribution.
- lower.tail: If TRUE (default), probabilities are #\mathbb{P}(X \leq x)#, otherwise, #\mathbb{P}(X \gt x)#.
Here, we have #C=91#. Thus, to calculate #z^*#such that #\mathbb{P}(-z^* \leq Z \leq z^*)=0.91#, run the following command:
\[\begin{array}{c}
\text{qnorm}(p = (100+C)/200, mean = 0, sd = 1, lower.tail = \text{TRUE})\\
\downarrow\\
\text{qnorm}(p =191/200, mean = 0, sd = 1, lower.tail = \text{TRUE})
\end{array}\]
This gives:
\[z^* = 1.6954\]
With this information, the minimum sample size can be calculated:
\[n=0.25 \cdot \Big(\cfrac{z^*}{k}\Big)^2=\Big(\cfrac{1.6954}{0.03}\Big)^2=798.437\]
Rounding this value up gives #n=799#.
Thus, for the margin of error to be no larger than #0.03#, you need a sample size of at least #799#.


