6. Parameter Estimation and Confidence Intervals: Practical 6
 Introduction
Objectives
Learn how to do the following in R
- construct a confidence interval for a mean on the basis of summary statistics as well as raw data
- construct a confidence interval for a proportion on the basis of summary statistics as well as raw data
Instruction
- Read through the text below
- Execute code-examples and compare your results with what is explained in the text
- Make the exercises
- Time: 180 minutes
Introduction
In this practical the central question is: based on a sample, what can we infer about the population? To learn about this we are going to use samples from a population to estimate population parameters (means and proportions) as well as the degree of uncertainty about these parameters.
But before we get to the estimation-part, let's first introduce the data that we will use. It presents information about green roofs in Amsterdam. The data is originating from the public data repository from the municipality of Amsterdam (https://maps.amsterdam.nl/groene_daken/ , see also https://maps.amsterdam.nl/open_geodata/ and https://maps.amsterdam.nl/ ) and is used for administrative purposes, policy-making but also to inform the general public.
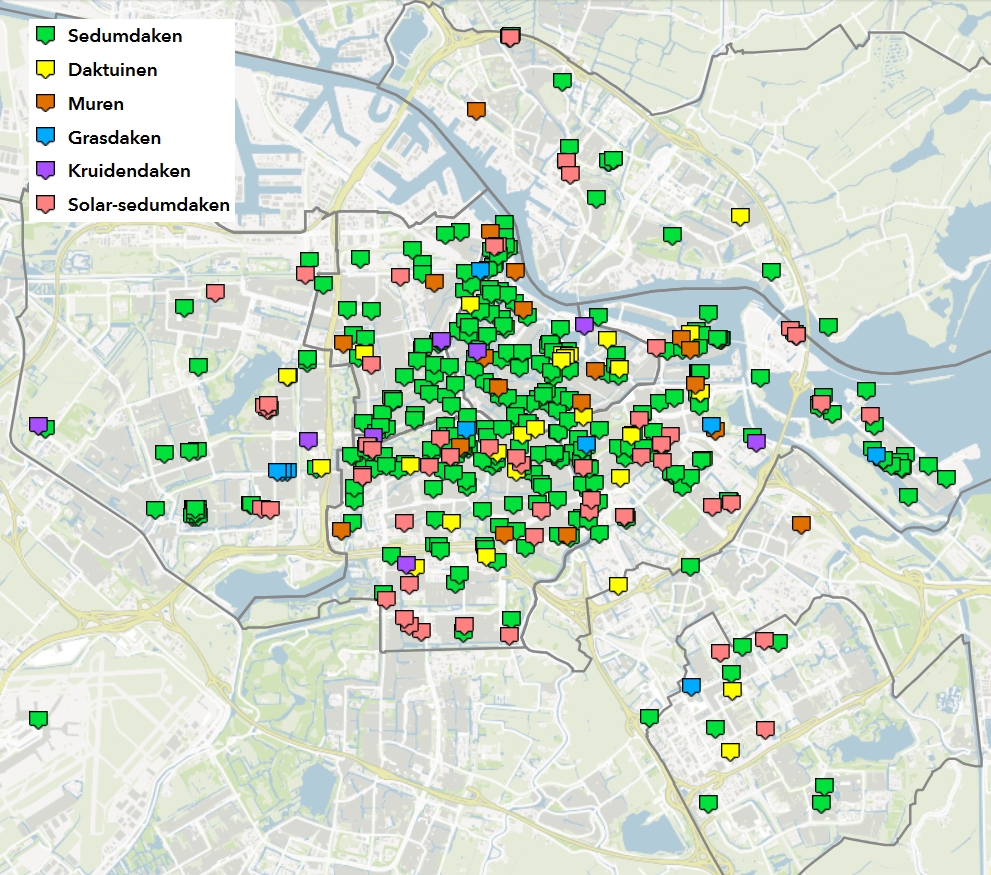
The map below illustrates some aspects of the data: the location of green roofs and its categorization into 6 different types. If you go to the website you will find that the map is interactive and you can find specific information attached to each icon.

The data on green roofs have already been downloaded and stored in a script, let's load it into R by executing the following command.
source('http://horizon.science.uva.nl/public/VVA/groenedaken.R')
After executing this command we have the data frames V and D in the R workspace. By exploring the contents of the two data frames we see that they contain different variables and that the information refers to different objects as well. Dataframe V contains information about water storage capacity and total volume that can be stored on a roof (this concerns 'sedumdaken' only), while dataframe D contains information about the different types of roofs as well as the neighbourhood ('stadsdeel') where the roof is located. In the first part of this practical we are going to use V.


