2. Association and Correlation: Practical 2
 Pearson Correlcation Coefficient
The Pearson correlation coefficient is used to calculate the direction and strength of a linear relationship between two variables. The Pearson correlation coefficient is a 'scaled' version of the covariance, such that it ranges from #-1# to #+1#. The greater the absolute value of the coefficient, the stronger the relationship.
The scatterplot of two variables gives not only an indication about the form and direction of the relationship; with a little practice, it will also give you an idea about its strength.
| Perfect positive linear relationship | 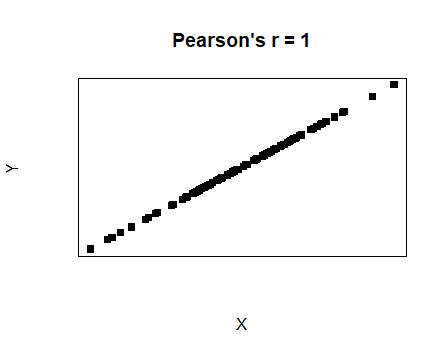 |
| Strong positive linear relationship | 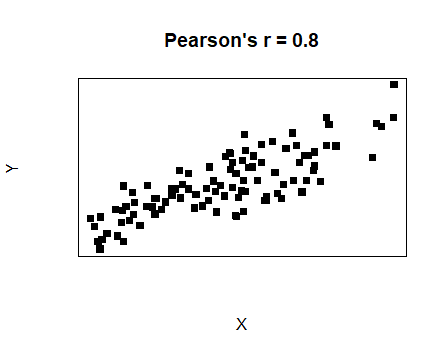 |
| Moderate postive linear relationship | 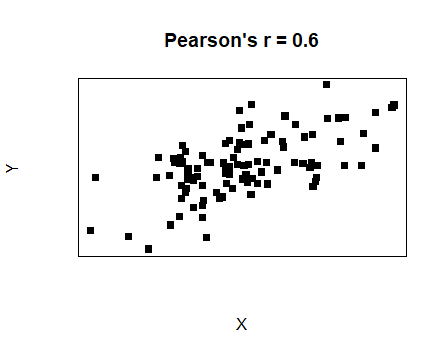 |
| Weak positive linear relationship | 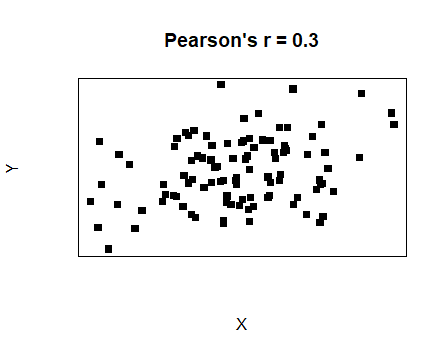 |
|
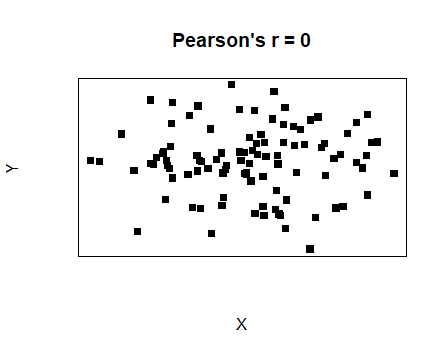
No linear relationship |
 |
Calculate Pearson's correlation coefficient in R
Of course, we can also calculate Pearson's correlation coefficient, instead of only estimating it's strength from the scatterplots. The equation is as follows:
#r(X,Y)=\dfrac{s_{X,Y}}{s_Xs_Y}#,
in which #r(X,Y)# is Pearson's correlation coefficient for the variables #X# and #Y#, #s_{X,Y}# is the covariance between #X# and #Y#, #s_X# is the standard deviation of #X# and #s_Y# is the standard deviation of #Y#. In R that would translate to
cor_xy <- cov(x,y)/(sd(x)*sd(y))
Alternatively, the correlation coefficient can be calculated by first applying a z-transformation to #X# and #Y# and then calculating the covariance. Recall that when we calculate the z-score, we subtract the mean and divide by the standard deviation. We should do that for each observation. Luckily, R has a function that does this for us: scale().
?scale
So #cor(X,Y) = cov(X_z,Y_z)#,
where #X_z = z#-#transformed# #X# and #Y_z = z#-#transformed# #Y# can be calculated in R with
cor_xy <- cov(scale(x), scale(y))
Lasty, and mosty conviniently, we can calculate the correlation coefficient directly with the cor() function.
cor_xy <- cor(x, y)


