9. Simple Linear Regression: Practical 9
 Introduction
Objectives
Understand that simple linear regression can be used to
- describe the relationship between two numerical variables
- test the hypothesis that two numerical variables are linearly related
- make predictions
Learn how to do the following in R
- fit a simple linear regression model on a dataset with a predictor and response variable
- produce and interpret the output from a regression model to describe the relation between two variables
- make predictions with a regression model
- produce and interpret the confidence intervals for the model parameters
- produce and interpret the confidence interval for the regression line
Instruction
- Read through the text below
- Execute code-examples and compare your results with what is explained in the text
- Make the exercises
- Time: 180 minutes
Introduction
Recall from chapter 2 that you need the form, direction and strength to describe the relation between two numerical variables. If the form is approximately linear, you can use Pearson's correlation coefficient to describe the direction and the strength. A correlation coefficient of #-1# indicates a perfect negative relation, a correlation coefficient of #+1# indicates a perfect positive relation and a correlation coefficient of #0# indicates no relation between the two numerical variables. Graphically the relation between two variables with a correlation coefficient of #0.8# looks something like Figure 1.

Now imagine that you want to use variable #X# to explain or predict variable #Y#. For example, you want to predict the height of children based on their age. Variable #X# (e.g. age) is then called the predictor (sometimes the term independent variable is used) and variable #Y# (e.g. height) the response variable (also called the dependent variable). You can then try to find the line through the points that best describes this association. Linear regression is a very effective way to find the best fitting line. It finds a straight line that minimizes the sum of the squared distances of each point to the line. In this practical, you will learn how to perform linear regression and how to interpret the results.
The data
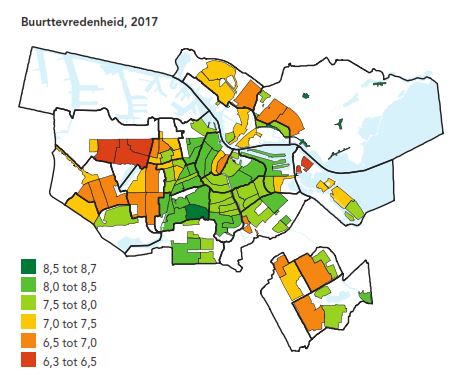
The municipality of Amsterdam is interested in how the inhabitants experience the quality of life in their neighbourhood. A bi-annual survey is conducted in which a large sample of the inhabitants are asked to score multiple indicators in their neighbourhood. For example, the satisfaction of inhabitants with the neighbourhood was scored on a scale from #0# to #10#. The average per neighbourhood is displayed in Figure 2. When this information is combined with socio-economic indicators and results from a survey on safety indicators, you get a reasonably complete view of the quality of life per neighbourhood.
Figure 2. Average answer to the question: How satisfied are you with your neighbourhood?
In this practical, you will work with a small subset of the available data from those surveys. More information can be found at https://www.amsterdam.nl/bestuur-organisatie/organisatie/ruimte-economie/wonen/onderz-woningmarkt/wia/.
You can load the data with the following command
source('http://horizon.science.uva.nl/public/VVA/amsterdam.R')


