Naive set theory: Elementary notions and notations
 Venn diagram
Venn diagram
Venn diagram
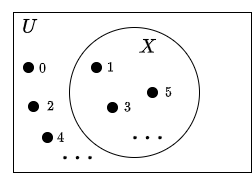
A Venn diagram of a set \(X\), named after the English logician John Venn, is a closed curve, usually a circle or ellipse, within which the elements of the set are represented by dots (no dots on edges). The universe \(U\) to which elements of \(X\) belong is represented by a rectangle. Objects that are not elements of \(X\) receive a dot outside the curve. With a sequence of dots, you can indicate that there are more, but unnamed elements in the set. The name of the set is usually placed inside the curve.
Example
In the example below, the universe is the set of natural numbers and \(X\) is the set of odd natural numbers.

Visualisations with Venn diagrams Venn diagrams are especially useful for visualising operations on sets, such as intersection, union, difference, and complement. We often leave out the elements of the sets in a Venn diagram and shade the intended set. Just select a set in the GeoGebra applet below.


